Are we really consuming more services?
 Print
Print Email
EmailConsumption patterns of American consumers: Services, durable goods and non-durable goods.
There is a widely held belief that American consumers are consuming more services and fewer durable and non-durable goods than in the past, with many commentators stressing that service industries are where we can expect growth in jobs and economic activity.
However, a recent analysis by YiLi Chien, Senior Economist at the St. Louis Federal Reserve Bank questions that belief.
According to Michigan State University Extension, this analysis suggests that while spending on services has increased, that does not mean that services as a share of total consumption has increased because the components have different inflation rates.
Consumer spending is usually broken down into three categories:
- Nondurable goods, such as food and clothing
- Durable goods, such as cars, furniture and home appliances
- Services, such as transportation, medical and education services
The first figure from Dr. Chien’s analysis plots the U.S. consumer spending share in terms of these three categories since 1959.
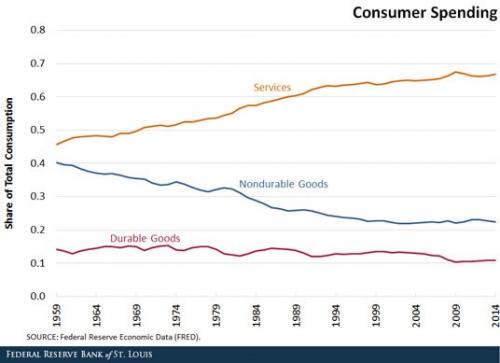
It is clear that spending on services has increased. The spending share of services increased from 46 percent in 1959 to 67 percent in 2014, while the share of nondurable goods dropped from 40 percent to 22 percent during the same period. This illustrates that American consumers have spent relatively more on services than durable and nondurable goods over time. Note that consumer spending on each category still increases over time because of positive economic growth.
However, spending more on services does not necessarily indicate that the real services consumption share is higher. Since, total consumer spending equals the price multiplied by the quantity, consumers might spend more on services simply because of higher prices for services.
To shed light on this issue, Chien adjusted the consumer spending in each category by its associated inflation index. This measures real consumption for each category, which is displayed in the figure below.
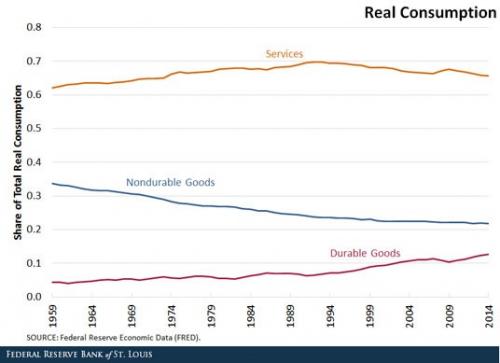
By adding differential inflation rates, a radically different picture emerges compared to the first figure. The real consumption share of services has been relatively stable, ranging between 62 percent and 70 percent and currently standing at 66 percent. The composition of the real consumption share between durable and nondurable goods has changed over time. The real share of durable goods consumption nearly tripled (4.3 percent to 12.7 percent) in our sample period. The real share of nondurable goods consumption has declined steadily (33 percent to 22 percent). In terms of relative share of real consumption, United States consumers have consumed more durable goods and less nondurable goods over time.
This analysis from the St. Louis Federal Reserve Bank demonstrates that the nominal share of consumption has behaved very differently from the real consumption share because of inflation. The higher inflation rate on services and the lower inflation rate on durable consumption goods play a critical role in accounting for the differences. The results suggest that when we discuss consumption patterns, we need to acknowledge differential inflation rates, not just look at spending. While we, as Americans, are spending less on goods and more on services, the actual consumption of durable goods ( e.g. cars, furniture and home appliances) has increased while consumption of non-durable goods (e.g. food and clothing) has decreased while consumption of services has been more stable.