Fall field crop update for Michigan’s Thumb region
 Print
Print Email
EmailFrom east to west and north to south, crops look consistent and are highly variable with both excellent and poor yields being reported with lower prices forecasted.
If you’re part of the group that likes the fall season when the colors start to change, you’ll have many farmers joining you in 2023. For the farmers, their livelihood depends on harvesting a bountiful crop, and it looks like a variable but good crop is in store for the year. Those outside of farming realize crop harvest is the end of the growing season, but many may not realize there’s plenty of work to still be done. Farmers will market and transport the crop in full earnest in the coming months. Futures prices for December corn and November soybeans compared to last year on Sept. 28 are -27.2% for corn and -7.7% for soybeans. A positive or negative net farm income for area farmers may come down to whether yields are above average, and crops are marketed during favorable pricing opportunities.
Weather
A good start with dry weather in June was followed by drenching rains that provided the moisture crops needed. When the growing season started, the soil had a full profile of water. When dry weather came, plant roots went deep to reach the water and provided a solid base for plant growth. Farmers in the southern half of Michigan’s Thumb may have seen very heavy rain events leaving fields with either flooding or hail damage.
|
Observed and normal (1991-2020) seasonal precipitation totals and base 50 F growing degree day (GDD)* accumulations**, May 1 – Sept. 30, 2023. |
||||||
|---|---|---|---|---|---|---|
|
Location |
30-year average (1991-2020) |
Normal |
Difference from normal |
|||
|
|
Rain (inches) |
GDD |
Rain (inches) |
GDD |
Rain (inches) |
GDD |
|
Sandusky |
14.32 |
2234 |
16.48 |
2230 |
2.2 |
4 |
|
Fairgrove |
17.95 |
2431 |
16.56 |
2420 |
-1.4 |
11 |
|
Pigeon |
15.84 |
2203 |
16.48 |
2230 |
0.6 |
-27 |
|
Richville |
15.12 |
2419 |
16.56 |
2420 |
1.4 |
-1 |
|
Emmett |
21.89 |
2039 |
15.94 |
2132 |
-6.0 |
-93 |
|
Lapeer |
18.02 |
2340 |
16.02 |
2508 |
-2.0 |
-168 |
*Observed precipitation and GDD totals based on data from Michigan State University Enviroweather.
**Daily base 50 F GDD accumulations are calculated with the 86/50 corn methodology.
Corn
Michigan State University Extension (MSU Extension) specialists think the dry weather earlier in the season led to corn standing still, ultimately leading to a delay in silking and the delay in maturity. Plants have stayed green throughout the growing season and plant maturity appears to be delayed up to one to two weeks. Once again researchers are seeing corn expressing a phenomenon known as growing degree day (GDD) compression. As the days shorten in length, the corn will mature with fewer than expected GDDs.
Any plant diseases detected have been seen later in the growing season this year, and that’s a good thing. One of the most watched and monitored diseases is corn tar spot. This fungus is found in corn residue from the previous year and can multiply quickly causing premature death of the plants. This can lead to reduced yields of more than 80 bushels per acre in bad years like 2021. Where heavy tar spot infestation is found, I encourage farmers to compare other hybrids as a choice for next year. The best tool for farmers against the disease is to select a hybrid with a higher degree of tolerance. Farmers are also encouraged to scout for lodging potential and then to harvest at risk fields first.
Soybeans
For this year’s soybean crop, I believe there is a high enough incidence of white mold to reduce the Thumb average. While there’s nothing that can be done to prevent the disease for the rest of this year, there are steps farmers can take to improve in coming years. Genetic resistance varies dramatically between soybean varieties. Farmers are encouraged to visit area plots that have white mold and talk with their seed suppliers about varieties that have improved resistance levels.
Like this year’s corn, the soybean crop will see a delayed harvest. Cloudy, rainy weather the last week of September helped farmers to push the pause button and allow the crop to drop more leaves and start to dry down.
Dry beans
There’s a trend towards a later maturing crop with all the commodities this fall, and dry beans are no different. Scott Bales, MSU Extension dry bean specialist, says, “Quality has been better than expected even with the wet weather during the summer.” Producers have reported a field that was a disaster due to flooding and then to have other fields be excellent. This adds up to hopefully an average crop of 20-22 bags per acre. The last week of above average temperatures and dry conditions were the perfect combination for farmers to harvest a majority of the remaining crop.
Forages (corn silage, alfalfa and grass)
Corn silage harvest will follow the same pattern as the other crops. Where water was abundant, corn will normally be able to use it and produce an excellent crop. This will be true except where ponding occurred causing the corn to be stunted or killed prematurely. Expect delays in harvest for 2023.
There were mixed reports this year in alfalfa and grassy hay. Some producers said they had the best year ever while others have been hampered by the frequent rain events leading to lower than expected quality due to harvest delays. For those that are looking for hay to buy, there will be a good supply. The challenge for 2023-2024 will be finding high quality hay for their livestock.
Wheat
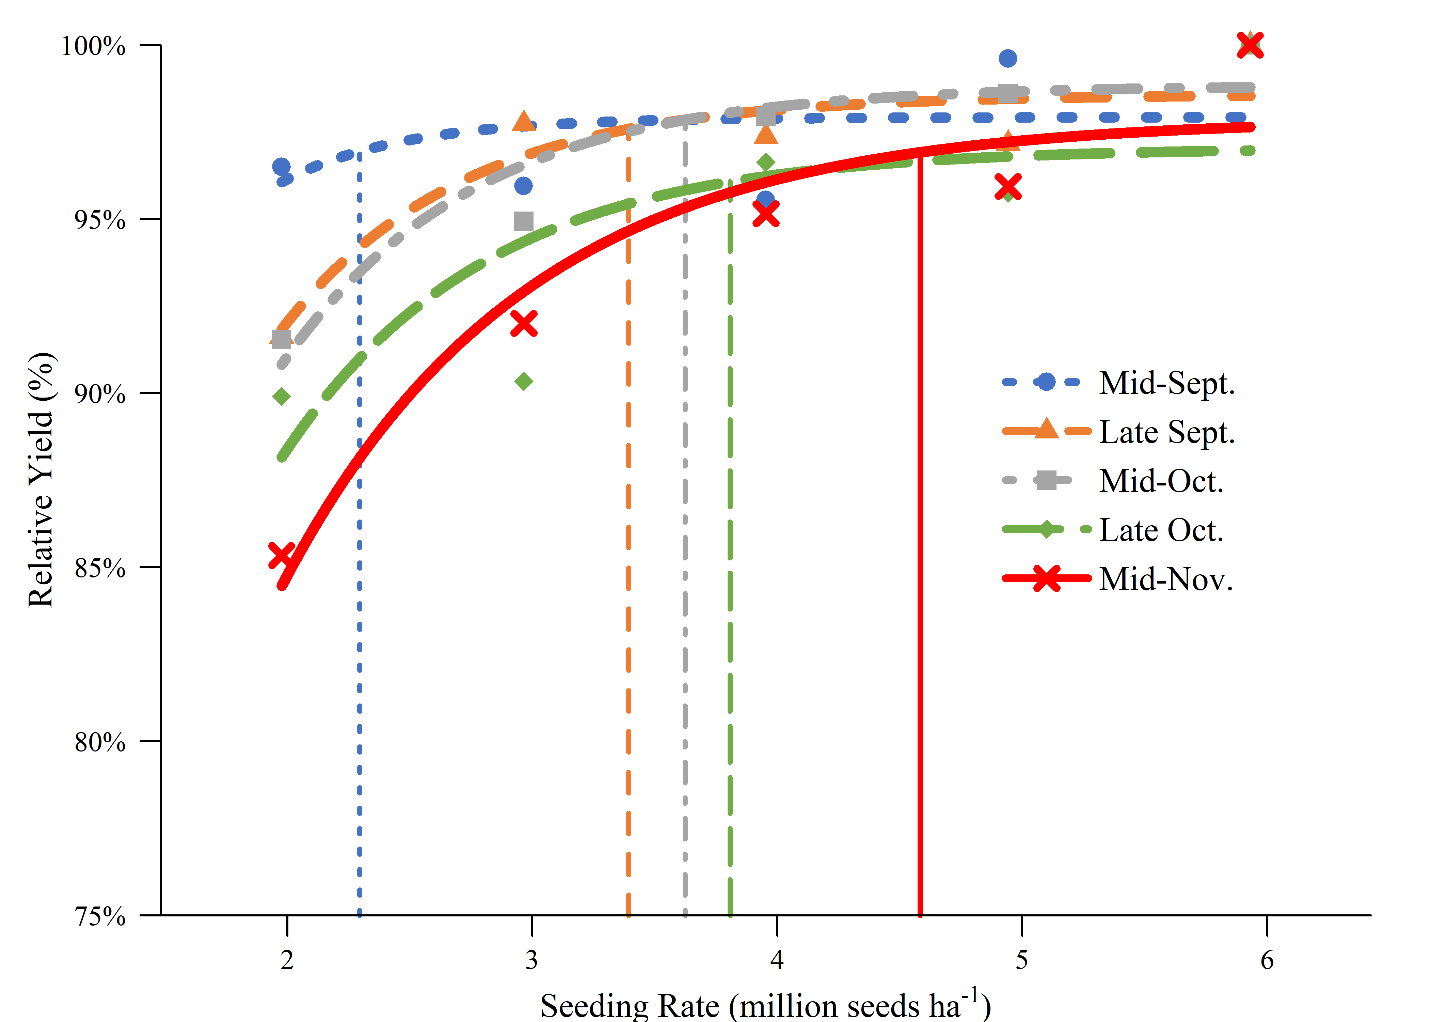
Initial projections are for wheat acres to be a bit below the 625,000 acres of wheat planted throughout Michigan in 2023, according to Dennis Pennington, MSU Extension wheat specialist. Because of the delay in dry beans, soybeans and corn silage, wheat plantings in the area will also be decreased. Producers are reminded that as they delay planting wheat, the planted population should be increased. Based on MSU research from Dennis Pennington and Maninder Singh (Figure 1), the following rates can be used for the agronomically optimum seeding rate based on planting date:
- Mid-September = 0.93 million seeds per acre
- Late-September = 1.37 million seeds per acre
- Mid-October = 1.47 million seeds per acre
- Late-October = 1.54 million seeds per acre
- Mid-November = 1.85 million seeds per acre