Print
Print Email
EmailMarket Outlook - August 2018
 So is the story the large corn and soybean crops coming this year, the fact that the five corn and soybean crops ever have been the past five years, and/or the tariffs on grains? And then, there is the large world corn and soybeans crops this year, but short wheat crop. Of course they are all significant factors, but the tariffs are what is making the market risky, the risk being poor prices given the large crops, and really poor prices with the tariffs, which we don’t how long will last, and could go and come back. The harm from the tariffs are real, whether the trade war is justified or not. And there is a possibility of longer run affects as well. Such as an increase in the investment in agricultural infrastructure in other parts of the world.
Corn
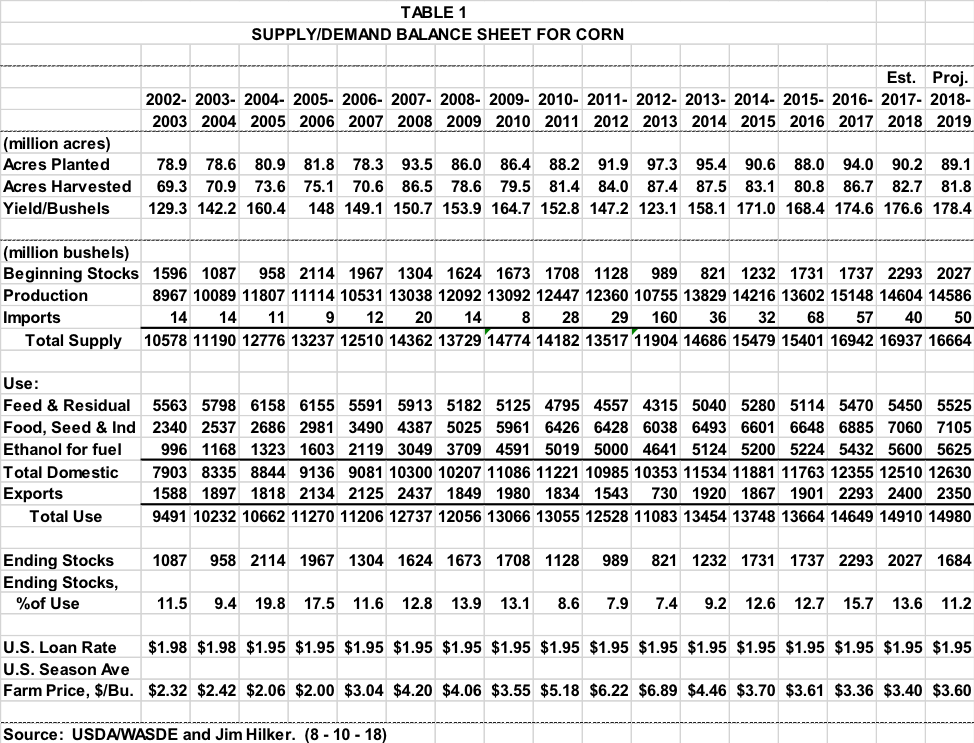
On August 10 the USDA/NASS released the first of the year survey based forecast for 2018 U.S. corn production at 14,568 million bushels based on August 1 conditions. This would be the third largest crop on record, just barely smaller than last year, 18 million bushels, 0.1 percent. The report indicated a record yield of 178.4 bu/ac, 1.8 bu/ac, 1%, higher than last year’s record. Illinois was projected to have an average corn yield of 207 bu/ac, with Iowa pegged at 202 bu/ac. The planted and harvested acres were based on the June Acreage Report, which showed planted corn acres down 1.2% and harvested acres down 1.1%.
The forecast is based on a large sample of farmer reported yield projections collected from all states, and field measurement objective yields in the largest corn producing states. The report assumes normal weather from August 1 through harvest. To this point moisture has been a bit less than normal, which may bring the final yield down a bit, but we are still looking at a huge corn crop being harvested this fall.
Michigan’s 2018 corn yield was forecast at 158 bu/ac, down one from last year, and three less than the record 162 bu/ac in 2015. Given much of Michigan was dry much of July, and August rains have been spotty, we will see how this yield holds as we finish the season. Michigan is expected to harvest 1.85 million acres, 50,000 acres less than last year, and the fewest since the high of 2.38 in 2012. Production is forecast at 292.3 million bushels, down 8 million from last year, the lowest since 2007, and 66.5 million below the record 358.8 million set in 2015.
The USDA/WASDE also released updated Supply and Demand Estimates on August 10. They can be seen in Table 1. At this point, 2018-19 total use is expected to be up from last year. Feed use is projected to be up 75 million bushels, based on more livestock units, and ethanol use is expected to be up 25 million bushels, with other uses being up 20 million bushels. While exports are expected to be down 50 million bushels, mostly based on larger world production. At this point the effects of tariffs are not clear, but remember Mexico is our largest buyer of corn.
So with lower total supply and more total use, ending stocks are projected to be down 344. Which lowers the stocks to use ratio from 13.6% to 11.2%. This leads to a projected $3.60 annual average 2018-19 price versus the $3.40 price for 2017-18. In Michigan the basis is fairly strong. If you have a lot of 2017 crop remaining, perhaps consider pricing on market rallies. But the risk is a settlement with Mexico could happen anytime, or not for quite a while, and what will the settlement be.
Wheat
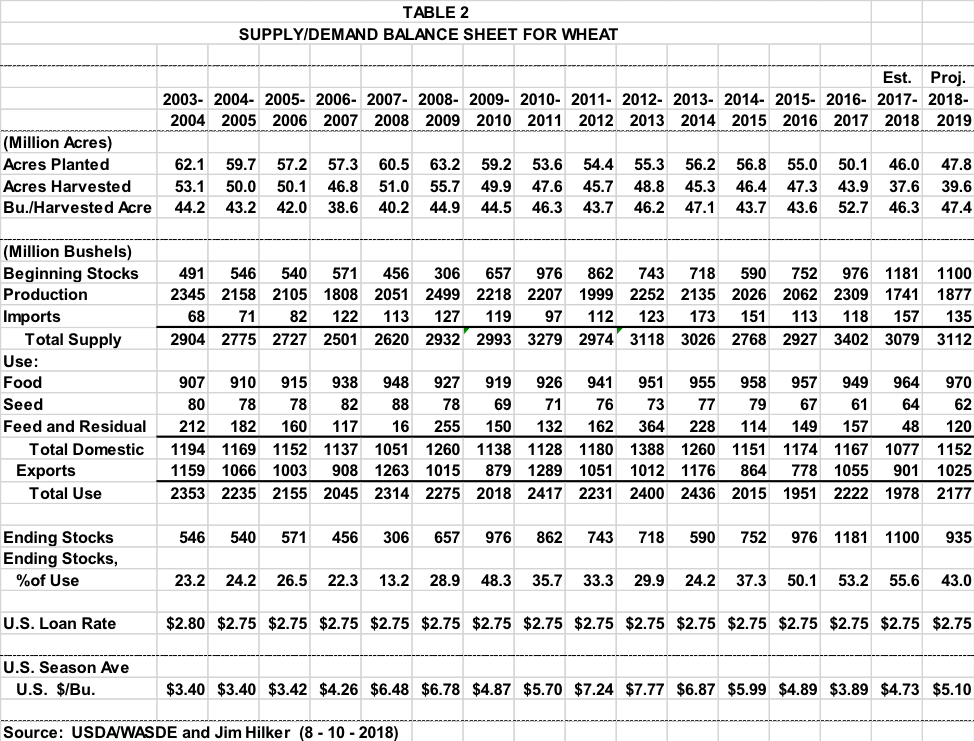
The August crop production numbers showed U.S. wheat production down less than 1%, 4 million bushels, from the July Report, but up 7% from 2017. Food use, feed use, and exports are expected to be up in 2018-19, with exports being the big increase, up 224 million bushels. The increase in exports is due to world wheat production being down about a billion bushels, mostly due to smaller crops in the EU and Russia. However, Russia will likely remain the largest exporter of wheat for the second year in a row.
Michigan 2018 wheat production was forecast at 39 million bushels, up from 33.575 million bushels in 2017. Michigan’s 2018 yield is forecast at 78 bushels per acre, down 1 from last year. But Michigan harvested 500,000 acres in 2017 versus 425,000 in 2017.
The wheat basis in Michigan is fairly strong, which is saying the market wants wheat. And while the market is willing to pay a bit for storage, it won’t cover the coast of most. Consider pricing some/much of remaining 2018 wheat on rallies, especially if we rally back to the high. And consider pricing some 2019 wheat on rallies past the previous highes.
Soybeans
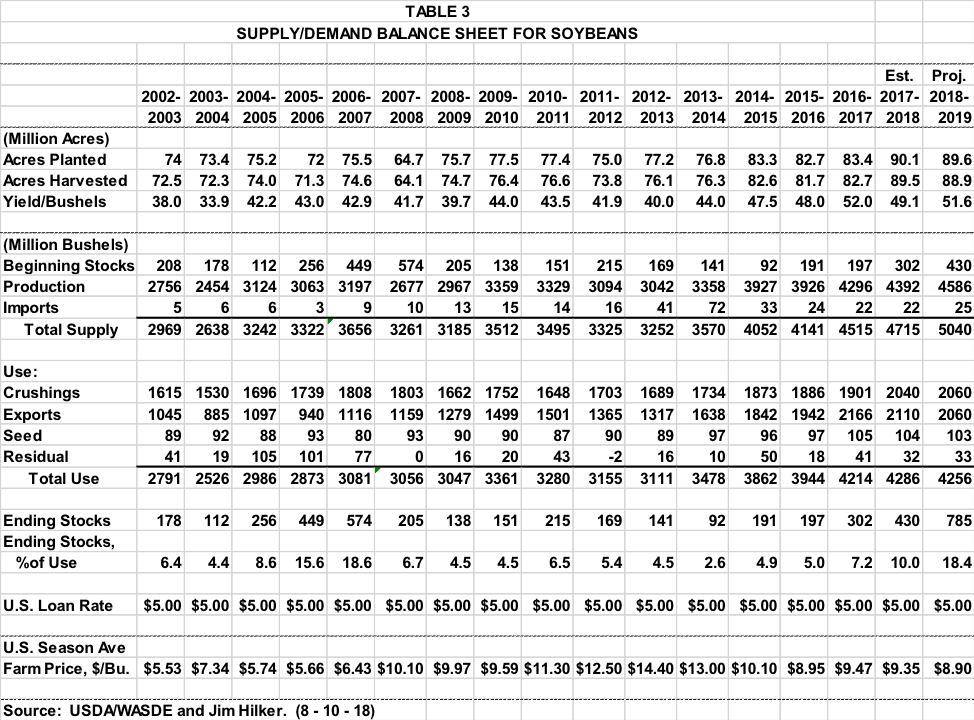
The August crop production report forecast the third record U.S. soybean crop in a row, 4,586 million bushels. The yield is projected to be 51.6 bu/ac, up 2.6 bu/ac from last year, and second only to the record 52 bu/ac in 2016. And while the yield may come in a bit lower given August rains to date, it will be very likely be the second highest yield on record. Harvested acres were projected at 88.9 million, down 0.6 million and the second highest on record. This number came from the June Acreage Report.
Michigan is projected to have a yield of 46 bu/ac, up 3.5 bushels from 2017, but below Michigan’s record yield of 50.5 bu/ac set in 2016. Michigan is expected to harvest a record 2.29 million acres, up 20,000 acres from this past year. This would put Michigan’s projected production at 105.34 million bushels, which would beat out the 104 million bushel record set in 2016.
The above numbers help put 2018-19 U.S. total projected supply at a record of record 5,040 million bushels, up 325 million bushels from 2017-18. The updated USDA supply and demand report indicates that total use will be down a bit from last year’s record, but will be a moving target depending on how the tariff situation plays out. Crush is projected to be up 20 million bushels, but exports are projected to be down 50 million bushels, which leaves total use down 50 million bushels. This leaves ending stocks at a massive 785 million bushels, easily surpassing the 2006-07 record of 574. Ending stocks to use is projected to be 18.4% of use, up from last year’s 10%. The 18.4% is basically a tie for second largest on record with several years, but below the 28% record in 1985.
The USDA projects an average annual 2018-19 price of $8.90/bu, down from $9.35 last year. Seems high to me without the tariffs coming off fairly soon. Remember, tariffs do not mean we won’t export soybeans to China, out largest market normally taking over 60% of U.S. exports. It means the Brazilian soybean prices will be 24% more than U.S. soybeans. Giving a market recommendation with the present situation is pretty much impossible. We have lower prices with the tariffs then we will have if they are taken off, both futures and basis are being affected.