New growing degree-day maps on Enviro-weather
 Print
Print Email
EmailInterpreting the newly revised growing degree-day maps on MSU Enviro-weather.
One of Michigan State University Enviro-weather’s most used applications, the growing degree-day (GDD) map series, has undergone a transformation in 2016. The format change was spurred partly out of the desire to update the maps, but mostly out of necessity as the technology previously used to produce the maps became obsolete.
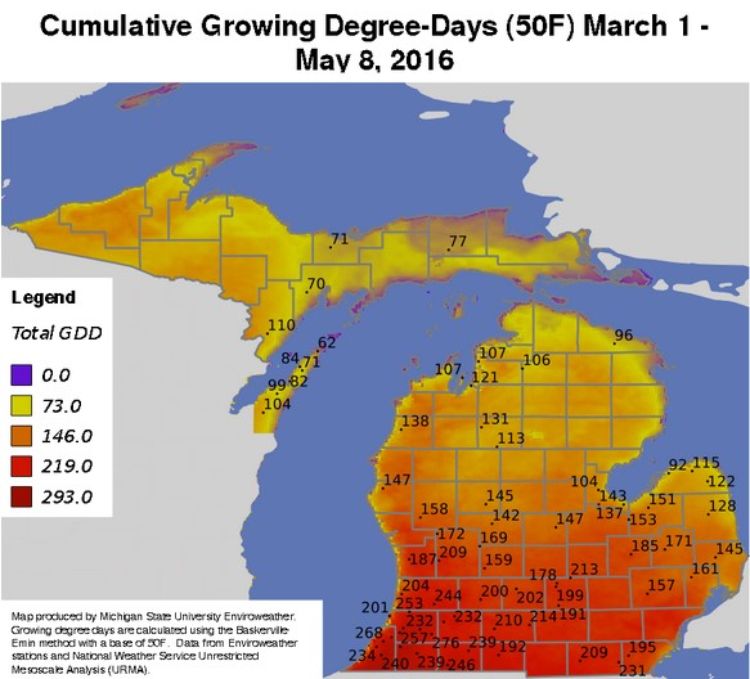
The GDD maps provide current seasonal accumulated degree-day (base 50) totals across the state as well as departures from normal in terms of GDDs and calendar days. The first map shows total degree-days (base 50) for a specific date. The 2016 version has improved color contrast and clearer numbers and should be easier to read. More than the appearance has changed, however. The source of the data used to produce the maps is also a bit different.

Accumulated degree days (base 50 F) for March 1 through May 9, 2015, using the previous version during 2015.
The data behind the new colored GDD surfaces are obtained from a new data product series from NOAA National Weather Service called UnRestricted Mesoscale Analysis (URMA). URMA is a collection of gridded weather datasets developed using a combination of numerical model output and available observations, which includes some Enviro-weather station data) The spatial resolution of the data is approximately 1.5 miles, which can provide highly detailed, contoured maps of weather variables and derived variables, such as GDDs, across a region of interest.
The Enviro-weather project carried out a lengthy comparative test of the gridded data values versus observed point data and, based on the positive results, has decided to apply the URMA data for our products when it is feasible. While the gridded data values are not quite as precise as the individual station observed data, they can still provide a good estimate of conditions in a given area, especially when there are missing observations or observing sites.
In addition to GDD accumulation maps, this Enviro-weather application also provides maps that compare the current degree-day accumulation to the climatological “normal.” There are two comparisons (maps) that can be accessed by clicking on “Current degree-day maps” on an Enviro-weather station page, and scrolling down the page. The first map (top) shows current GDD totals in comparison to normal in terms of number of calendar days ahead or behind. For example, if the current observed GDD total at a given location is 50 units greater than the climate normal and the normal accumulation at that point in the season is 10 GDDs per day, the map will indicate that the GDD totals are 50/10 or five days ahead of normal. The second (bottom) map shows current GDD totals in comparison to normal in terms of GDD units. Both give users a feel for the progress of the growing season compared to what has been observed in the past.
It is important to note that the new 2016 version incorporates slightly different data for determining what is “normal.” To calculate “normals” in the old version of this product, climatic data from 1981 to 2007 was used. For the new 2016 version, we have utilized data from 1981-2010, which is the current international standard 30-year period for climatic normals.
One final note of caution: Given that the daily GDD normals were calculated with station data from about 90 individual sites within and near the state, which is everything that was available at the time they were developed, the spatial normal GDD patterns may in some cases be less detailed over space than is the case with the new URMA data. As a result, you may see some relatively larger departures from normal that spatially appear to be related to geographical features. In Michigan, this issue is most common in lakeshore areas where air temperatures and GDD totals may vary significantly over only short distances, especially during the spring season when the relatively cool lakes slow accumulation of GDDs. Enviro-weather is working with our new normals database to reduce the risk of this issue and any differences are expected to be relatively small.