New meteograms now available on MSU Enviroweather
 Print
Print Email
EmailNear real-time weather data in graphical format allows users to visualize weather over time.
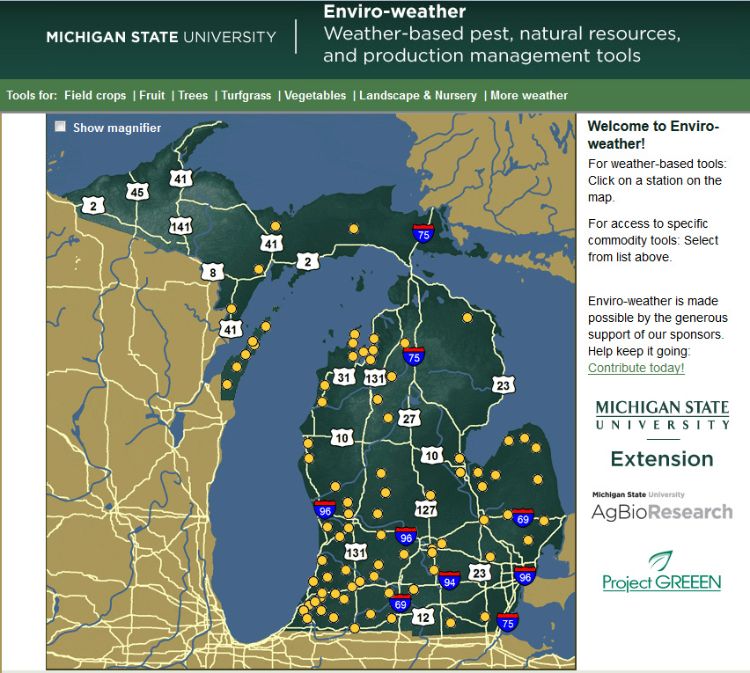
Michigan State University’s Enviroweather is excited about a new application that will help users understand changes in local weather conditions. Graphical displays called “Meteograms” are now available for all stations. They show graphs of individual weather variables (temperature, humidity, wind speed, etc.) at 5-minute intervals as recorded by Enviroweather stations.
To see the new meteograms, go to the Enviroweather website and select a station by either clicking on a yellow dot (Photo 1) or using the pull-down menu on the upper right side of the screen (Photo 2).
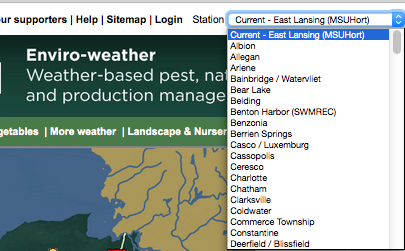
Photo 2. Select a station using the drop-down menu.
You will be taken to the station page. Under the “Weather Observations and Summaries” heading, select “Meteogram: Real-time observations in graphical format” (Photo 3).
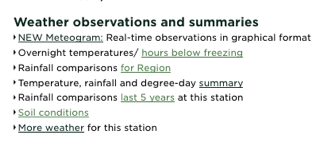
Photo 3. Select “Meteogram: Real-time observations in graphical format.”
The meteogram for your selected station will be shown. Three different graphs are available. The first graph shows temperature, dew point and (if applicable) heat index or wind chill (Photo 4).
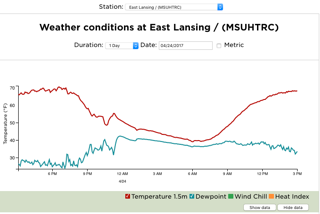
Photo 4. Temperature, dew point and (if applicable) heat index or wind chill are given.
The second graph shows rainfall, relative humidity and leaf wetness (Photo 5).
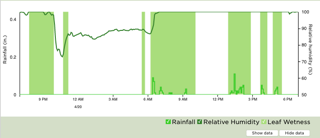
Photo 5. Rainfall, relative humidity and leaf wetness are given.
The third graph shows wind speed.
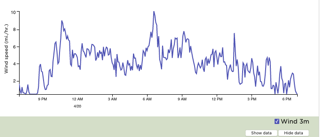
Photo 6. Wind speed is given.
Mousing over any line on the graph will bring up a pop-up box displaying the weather variables at the time selected. If you move your mouse to the right or left, the data will change, showing how these variables change with time (every 5 minutes.) (Photo 7).
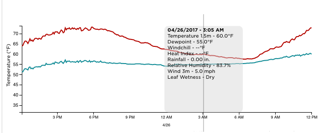
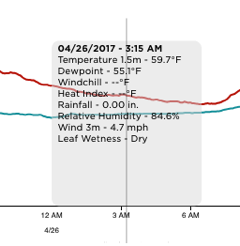
Photo 7. Positioning your mouse over any of the meteogram lines will bring up a text box that lists values for each weather variable at the designated time. If you move the mouse to another time, new values will appear. The photos above show the values at 3:05 a.m. and 3:15 a.m. at the Haslett Enviroweather station.
Each weather variable is color-coded and its numerical display can be toggled on and off using the check box in the lower right corner of the graph. Right below the check boxes are buttons to “hide” and “show” the data (Photo 8). Click on the “show data” button to display the data as numbers (Photo 9) and click on “hide data” to show just the graph.
In addition, you can turn the line display of any variable on or off by clicking on the checked boxes located just below the graph on the lower right side (Photo 8).
![]()
Photo 8. Check boxes to either hide or show certain data.
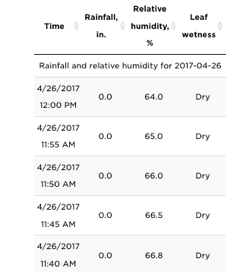
Photo 9. Data appears in tabular for when “show data” button is clicked.
When you select the meteograms, graphs show data for the current day (24 hours) by default. You can change settings to see other dates and other time periods. Pull-down menus at the top of the page allow you to change the station, the date and the time interval shown (from 6 hours to one week) (Photo 10).
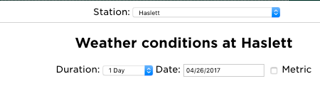
Photo 10. Change settings to see data from different stations, change duration and change date.
These new graphical tools will provide users more detailed information about current and past weather, help users understand past conditions and make informed pest and crop management decisions.
As always, if you have questions or comments about this new tool, please contact me at 517-432-6520 or eweather@msu.edu.