Phosphorus concentration fluctuates rapidly like a nutrient roller coaster
 Print
Print Email
EmailUnderstanding the timing of phosphorus loss helps guide decisions aimed at reducing harmful algal blooms in Lake Erie.

Researchers at Michigan State University Extension have been pondering a crucial question for a while: How can we achieve our objective of minimizing phosphorus (P) runoff into Lake Erie? Understanding the timing of P loss is instrumental in shaping our decision-making process.
Important takeaways
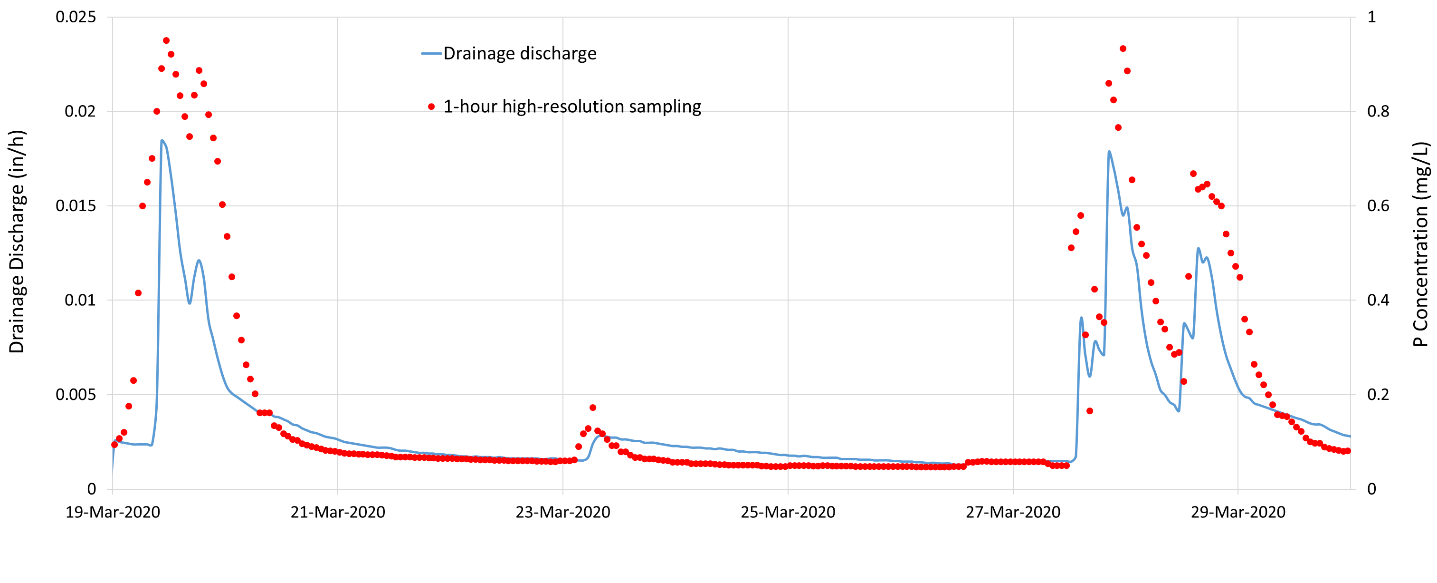
- Phosphorus concentration in subsurface drainage discharge fluctuates drastically during event flows (Figure 1).
- Generally, the higher the flow, the higher the P concentration.
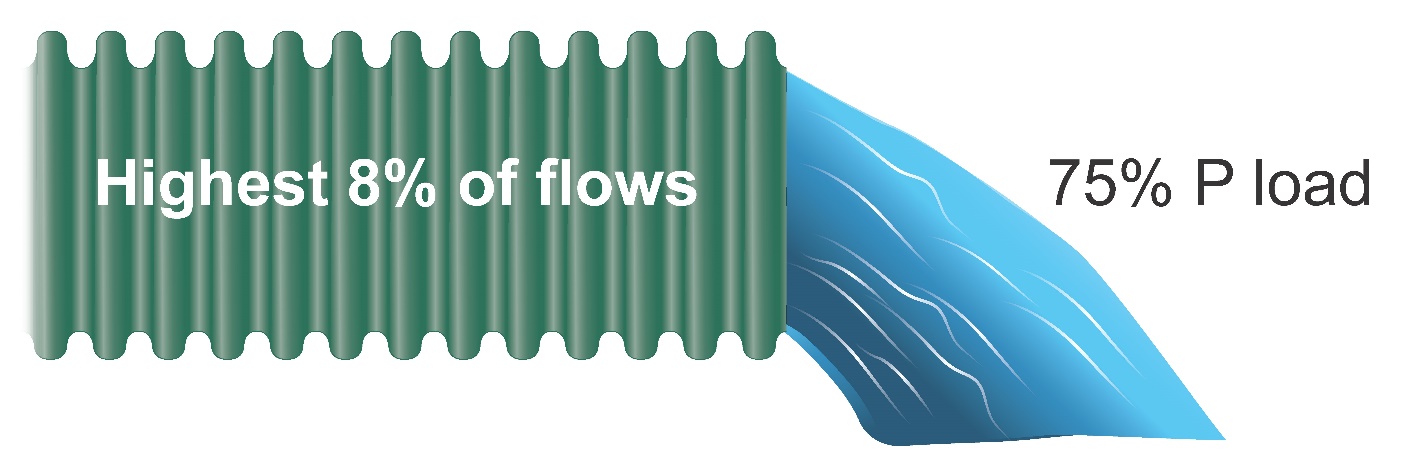
- The highest 8% of the flows contributed to 75% of the P load.
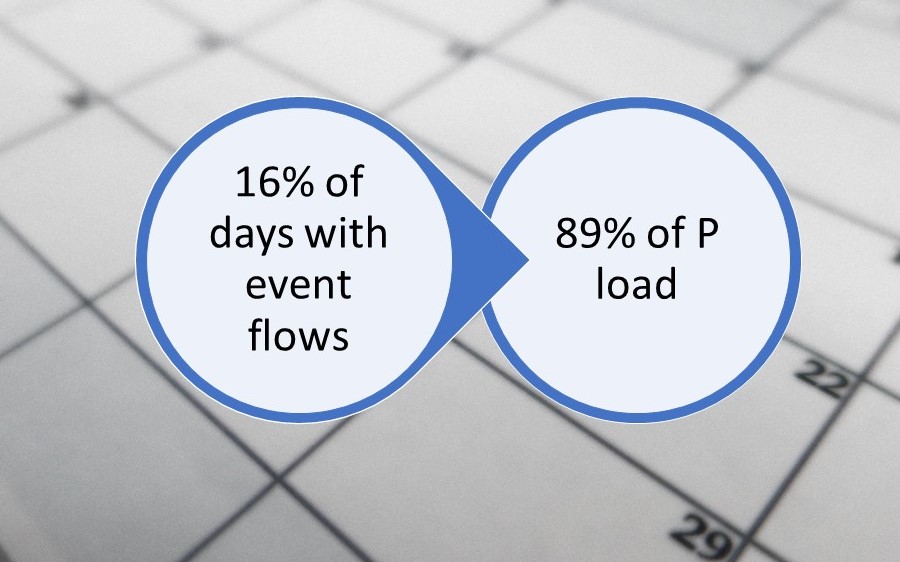
- Out of 344 days of monitoring, 54 days (16%) had event flows and were responsible for a substantial 89% of P loss.
- The biggest bang for the buck is to reduce P loss from large flows, especially during the non-growing season.
Why does reducing nonpoint-source phosphorus loss matter?
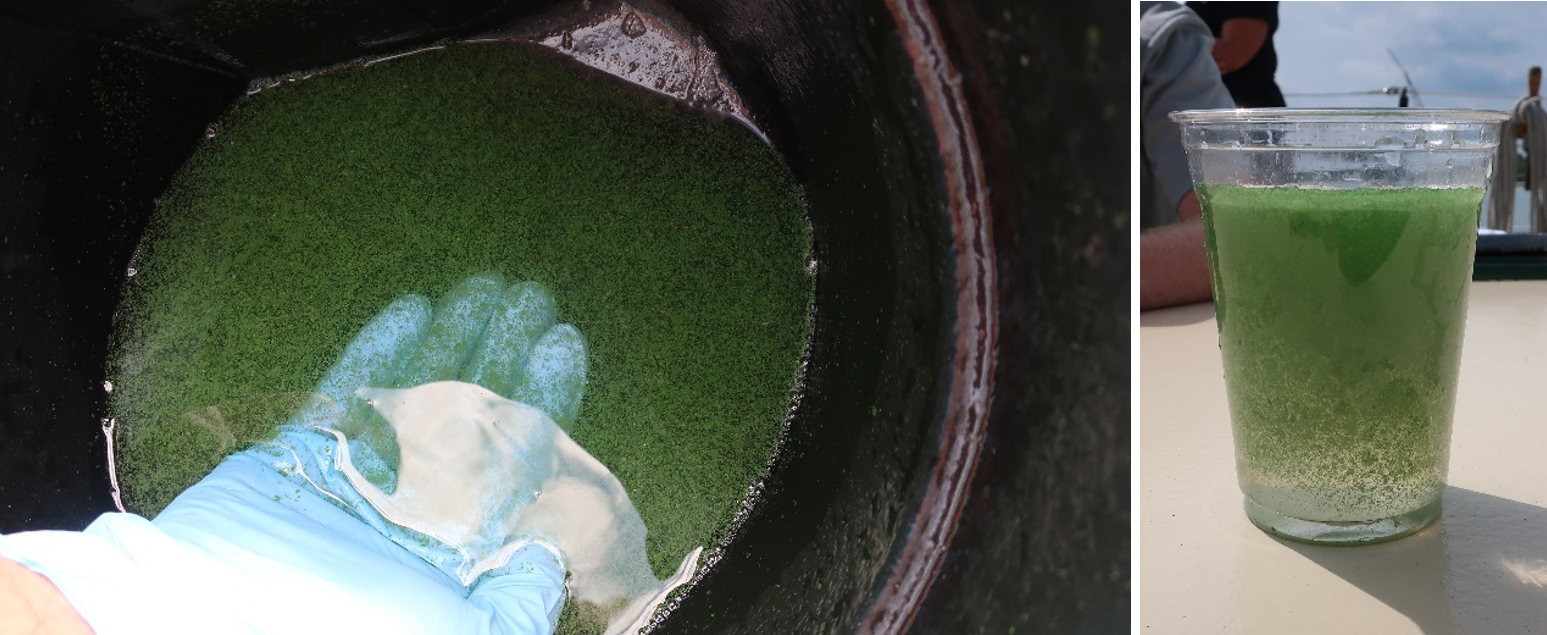
Some of the P leaves the farm with water through the subsurface drainage system. There are various sources of P entering Lake Erie, but agriculture is a dominant source. When P gets into surface water bodies like Lake Erie, it causes algal blooms (Figure 2). The algal blooms harm the environment, pose a health risk and hurt the economy. In this article, we explore how P concentration varies with changes in flow. Then, we present four strategies for reducing P loss.
Phosphorus concentration fluctuates drastically during event flows
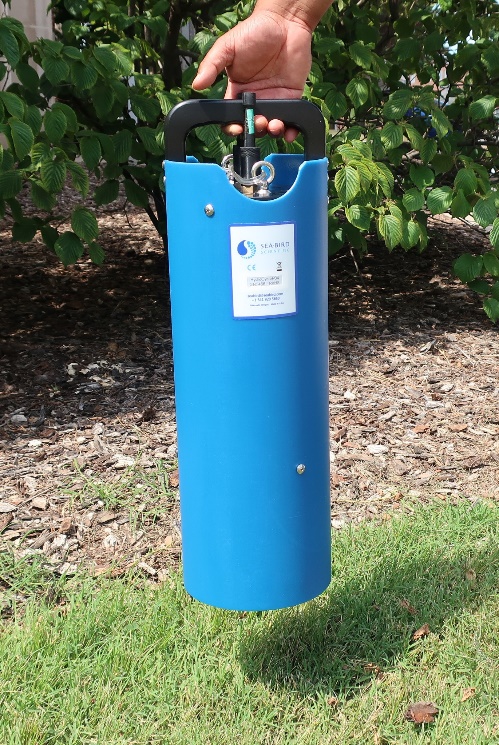
We used a HydroCycle in-field automated lab (Sea-Bird Scientific) to get hourly P concentration at a no-till farm with manure application in Lenawee County, Michigan (Figure 3). This instrument showed that P concentration increases rapidly with rise in flow and then decreases quickly with a drop in flow (Figure 4). We were astonished to find such rapid increases in P concentration as fast as 0.7 mg/L per hour when flow increased from baseflow to peak. The rapid variation in P concentration was driven by the magnitude of the event flow. This means that generally the higher the flow, the higher the P concentration. Overall, P concentration fluctuated rapidly every time there was flow. Now that we know P concentration fluctuates rapidly, what does this mean for P load?
Large event flows dominate P loss
When translating the P concentration into P load, we found that the highest 8% of the flows were responsible for a staggering 75% of the phosphorus load lost through drainage discharge (Figure 5). Both the higher flows and the higher P concentrations during those flows were responsible for the substantial contribution of precipitation-driven flows to the overall P loss. This drastic P contribution of high flows was made observable by the HydroCycle unit that captured the rapid changes in P concentration. Our results show that large flows pose the greatest risk to P loss, more than we previously thought.
Let’s explain the importance of large flows to P loss from a different perspective. During the 344 days of monitoring, baseflow occurred for 290 days and event flow occurred for 54 days. An event flow is when drainage discharge occurs in response to rainfall or snowmelt. It was fascinating to find that only 16% of the days had event flow (54 out of 344 days) and were responsible for a substantial 89% of P loss (Figure 6). Generally, the longer the duration of the event flow and the higher the peak, the greater the P loss in drainage discharge.
Strategies for reducing phosphorus loss
Use a combination of four strategies to reduce P loss:
- Reduce surface runoff by improving soil health.
- Reduce soil test P and apply fertilizer as needed with 4R nutrient management.
- Reduce the amount of water leaving the field with water management.
- Capture phosphorus leaving the field with a phosphorus removal structure.
For more information about water management and drainage, visit the MSU Extension Drainage website.
Acknowledgement
The Michigan Department of Agriculture and Rural Development (grant no. 791N7700580) provided funding for this research.