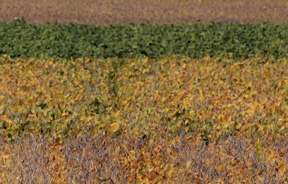
Soybean planting date research in 2011 shows a big difference to bottom line
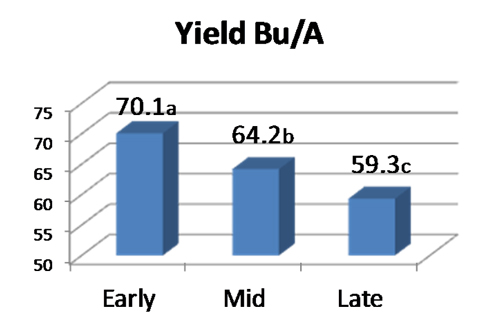
Early planted soybean study in Michigan’s Thumb region shows a 15.2 percent yield increase worth $122 over late-planted soybeans for the 2011 growing season.
During the 2011 growing season, research was conducted in Michigan’s Thumb region to evaluate the differences planting date would have on yield and gross value per acre. In the trial, populations were also planted at rates ranging from 80,000 seeds/acre to 240,000 seeds/acre. Michigan  State University recommends soybeans to be planted early to have maximum yield potential. The first two weeks of May is considered the ideal planting window for soybeans in the lower half of the Lower Peninsula. The Michigan Soybean Promotion Committee sponsored the research grown on Zwerk & Sons Farms in Richville, Mich. The results were published in the 2011 Thumb Ag Research & Education (TARE) Field Trials Report and the 2012 Field Crops On-Farm Research & Demonstration Report.
Soybeans were planted in 20-inch rows in the same field at three different planting dates to simulate what the effects of delayed planting would be, similarly to what many farmers faced in the spring when cold, wet weather forced many to delay planting until early June. The first planting was done on May 10 and then every two weeks thereafter. Due to the wet conditions in the Thumb region, if we hadn’t been able to plant on May 24, it would have been the first part of June before we were in the field again.
Even with the wet weather in May, nearly ideal growing conditions followed, allowing the soybeans to emerge evenly and receive a timely herbicide application. Yield results for the plot are found in Figure 1. The value of the soybeans at harvest was $11.34 per bushel, giving the early planted soybeans a whopping $122.47 advantage over the late-planted treatment and $66.91 over the mid-season planting. Growers should be cautious about putting too much emphasis on one year’s results. The comparison can be made between data from Wisconsin and Minnesota in Table 1.
The study is slated to be continued for two more years. For more details on the study, the results are available in the 2011 TARE Field Trial Results on pages 27-28.
Figure 1. Michigan yield results 2011
Table 1. Wisconsin and Minnesota soybean planting date study
|
Planting Date |
Wisconsin |
Minnesota |
|
May 20 |
100% |
97% |
|
June 1 |
89% |
91% |
|
June 10 |
75% |
82% |
|
June 20 |
68% |
70% |
|
July 1 |
61% |
57% |


 Print
Print Email
Email


