Bulletin E3151
Climate Basics
DOWNLOAD
November 17, 2015 - Jeff Andresen
 Print
Print Email
Email|
The Earth’s climate is a complex system and is influenced by many factors, including human activities. It has changed greatly in the past and will continue to change in the future. Depending on whether future greenhouse gas emissions stabilize or increase, we can expect warming of the planet similar to or greater than recent years. |
What drives Earth’s climate system?
Mark Twain once said, “Climate is what we expect, weather is what we get.” The terms “weather” and “climate” are closely related but have subtly different meanings. Both refer to changes in atmospheric variables — such as air temperature, humidity, wind and clouds — but over different periods of time. On the basis of an international agreement of climatologists, a period of three consecutive decades, or 30 years, is commonly used to describe climate at a given location1. Weather, on the other hand, refers to the same variables but over much shorter periods of time — hours or days.
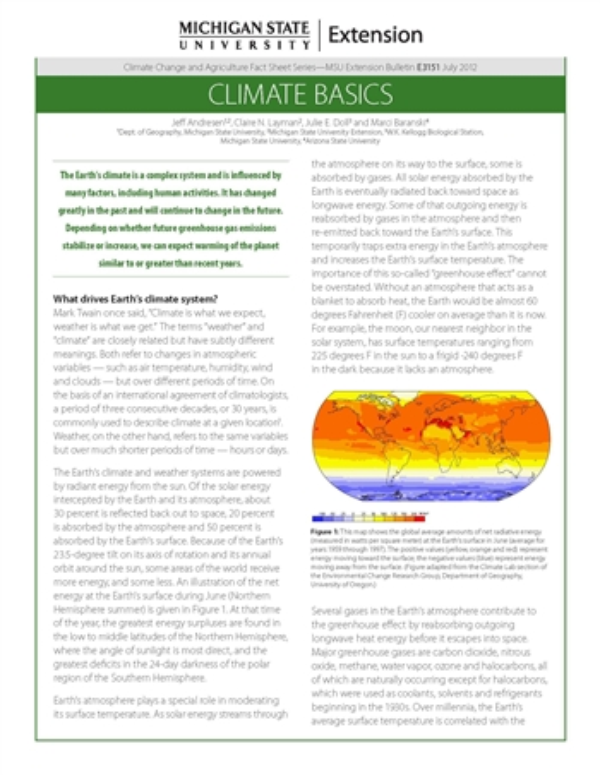
The Earth’s climate and weather systems are powered by radiant energy from the sun. Of the solar energy intercepted by the Earth and its atmosphere, about 30 percent is reflected back out to space, 20 percent is absorbed by the atmosphere and 50 percent is absorbed by the Earth’s surface. Because of the Earth’s 23.5-degree tilt on its axis of rotation and its annual orbit around the sun, some areas of the world receive more energy, and some less. An illustration of the net energy at the Earth’s surface during June (Northern Hemisphere summer) is given in Figure 1. At that time of the year, the greatest energy surpluses are found in the low to middle latitudes of the Northern Hemisphere, where the angle of sunlight is most direct, and the greatest deficits in the 24-day darkness of the polar region of the Southern Hemisphere
Earth’s atmosphere plays a special role in moderating its surface temperature. As solar energy streams through the atmosphere on its way to the surface, some is absorbed by gases. All solar energy absorbed by the Earth is eventually radiated back toward space as longwave energy. Some of that outgoing energy is reabsorbed by gases in the atmosphere and then re-emitted back toward the Earth’s surface. This temporarily traps extra energy in the Earth’s atmosphere and increases the Earth’s surface temperature. The importance of this so-called “greenhouse effect” cannot be overstated. Without an atmosphere that acts as a blanket to absorb heat, the Earth would be almost 60 degrees Fahrenheit (F) cooler on average than it is now. For example, the moon, our nearest neighbor in the solar system, has surface temperatures ranging from 225 degrees F in the sun to a frigid -240 degrees F in the dark because it lacks an atmosphere.
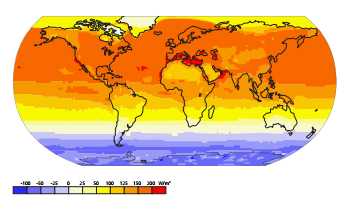
Figure 1: This map shows the global average amounts of net radiative energy (measured in watts per square meter) at the Earth’s surface in June (average for years 1959 through 1997). The positive values (yellow, orange and red) represent energy moving toward the surface; the negative values (blue) represent energy moving away from the surface. (Figure adapted from the Climate Lab section of the Environmental Change Research Group, Department of Geography, University of Oregon.)
Several gases in the Earth’s atmosphere contribute to the greenhouse effect by reabsorbing outgoing longwave heat energy before it escapes into space. Major greenhouse gases are carbon dioxide, nitrous oxide, methane, water vapor, ozone and halocarbons, all of which are naturally occurring except for halocarbons, which were used as coolants, solvents and refrigerants beginning in the 1930s. Over millennia, the Earth’s average surface temperature is correlated with the amount of greenhouse gases in the atmosphere, as shown in Figure 2. Historically, when greenhouse gas concentrations have been relatively high, so have the average surface temperatures. (See MSU Extension Fact Sheet E3148 for more about greenhouse gases.)
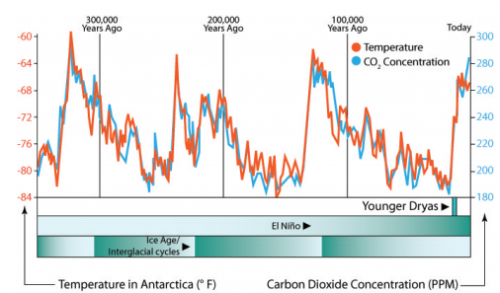
Figure 2: This figure shows the correlation between air temperature and carbon dioxide concentrations at Vostok, Antarctica, from 350,000 years ago through the present. The red line represents temperature in degrees Fahrenheit, and the blue line represents carbon dioxide (CO2 ) concentration in parts per million. In recent years, carbon dioxide levels have spiked higher than at any time in the previous 350,000 years of data. (Figure adapted from the Marian Koshland Science Museum of the National Academy of Sciences.)
What factors affect weather and climate?
The climate of a given location on the Earth’s surface is determined by:
1) Latitude.
2) Proximity to oceans.
3) Large-scale atmospheric and ocean circulation patterns.
4) Elevation.
5) Topographic barriers and features, such as mountains.
The flow of energy from areas of surplus energy (generally close to the equator) to areas of deficit energy (near the poles) drives the Earth’s weather and climate systems. This energy imbalance, along with the Earth’s daily rotation on its axis, results in the large-scale general circulation of air flow at the Earth’s surface. There are three circulation patterns in each hemisphere. These are more commonly known as the Polar Easterlies, the Westerlies and the Trade Winds, which cover polar, midlatitude and tropical zones, respectively. In between these three circulation patterns in each hemisphere is a narrow zone of converging winds in the tropics called the Intertropical Convergence Zone. All of these circulation features migrate seasonally toward the poles and toward the equator.
What causes the climate to change?
The climate at a given location seems to be relatively stable, but it is ever-changing because of its dynamic nature and many components. For example, Michigan’s climate has varied dramatically over time from tropical to glacial conditions. Extensive geological evidence associated with these diverse climates and climatic changes is visible across Michigan’s landscape (see Figure 3).
Several processes are linked with major changes in global climate in the past, including:
1) Global plate tectonics — shifting of continental land masses.
2) Sunspots, which are linked with variations in solar energy output.
3) Variations in Earth’s orbit, described by the Milankovitch theory.
4) Volcanoes, such as Mt. Pinatubo in 1991.
5) Meteor impacts, such as the one that caused a global cooling and extinction event 65 million years ago.
6) Periodic changes in the Earth’s carbon and nitrogen cycles, including changes in atmospheric greenhouse gas concentrations.

Figure 3: The Petoskey stone is a form of fossilized coral and the state stone of Michigan. The coral dates from the late Devonian Period, approximately 350 million to 400 million years ago. At this time, the Euramerican tectonic plate — containing what is now the Great Lakes region — was located near the equator in a tropical climate and mostly covered by a shallow sea. (Image from Chris Savage.)
All of these processes act to change the amount of energy reaching the Earth’s surface. They range from the location of the continents on the Earth (which affects how the planet’s surface reflects incoming solar energy) to massive ejections of dust or ash into the atmosphere (which reflects a higher portion of the incoming energy). For example, the eruption of the Mt. Pinatubo volcano in the Philippines during the summer of 1991 led to a global cooling of more than 1 degree F that lasted more than a year. As a result, the average temperature in Michigan during the summer of 1992 dropped more than 4 degrees F below normal. Many crops failed to reach maturity that growing season because of the significantly cooler temperatures.
The Milankovitch theory is based on three types of small, periodic changes in the Earth’s orbit: changes in the Earth’s 23.5-degree tilt, the shape of its elliptical orbit and the date at which the Earth reaches its closest and furthest points away from the sun. Approximately every 100,000 years, these cycles collectively lead to relative reductions in total incoming solar energy at high latitudes of up to 20 percent. These are thought to be the leading cause of the onset of glacial periods2.
Human activity is causing increasing concentrations of greenhouse gases in the atmosphere. Since the beginning of the industrial revolution around 1765, concentrations of carbon dioxide (the main greenhouse gas) and other greenhouse gases in the Earth’s atmosphere have increased from 12 percent to 240 percent. The higher concentration of greenhouse gases has decreased the amount of energy allowed to radiate from Earth back into space by 2 to 3 watts per square meter (W/m2 , a measure of energy)3 .
If current rates of greenhouse gas emissions continue, the Earth could retain between 5 and 10 W/m2 more energy (relative to 1765) by the end of the 21st century. Climatologists estimate that this change may ultimately result in a 2- to 7-degree F increase in average global temperatures by the end of this century4 . Compared with the large climatic changes of the geologic past, this type of warming would be very unusual because of the amount of warming that is occurring over a very short time period. Global temperature changes are typically much more gradual, occurring over tens of thousands of years or longer.
It is important to note that humans are not changing the overall amount of carbon, nitrogen or other greenhouse gases in the Earth’s global environmental system (with the exception of halocarbons). Human activity is altering the form and location of these elements between Earth’s surface and the atmosphere, which in turn drives changes in the climate. For example, fossil fuel combustion coverts carbon that had been stored as a solid or liquid deep in the Earth to carbon dioxide gas that enters the atmosphere, leading to the enhanced greenhouse effect and warming of the Earth. This has strong implications for sustaining our quality of life: although humans already have altered Earth’s climate, policies and individual actions can help to mitigate future changes.
Figure 4: This chart shows the average annual global air temperatures from 1880 to 2010 (in degrees Celsius). The red bars express the yearly difference between the global average and a baseline reference of the 1901-2000 average temperature. For each year, the range of uncertainty is indicated by the gray vertical bars. The thick blue line is a nine-year moving average of the individual years and helps identify longer term trends. (Figure from NOAA National Climatic Data Center following Smith et al., 2008.)
How much has the Earth’s temperature changed?
Scientific observations of climate have been recorded at locations around the world for about the past 200 years. Even so, the search for climate trends over time is complicated because changes in station location, station environment, observation time, observer and type of instrument can result in artificial changes in climate. Scientists address these known problems and use only the best quality climate records. These records indicate that the average annual global surface temperature has warmed roughly 1.3 degrees F since the late 1800s (see Figure 4)5 .
As seen in Figure 4, there are some obvious temperature patterns, including the following fluctuations in the average global temperature:
- A period of decreasing temperatures (about 0.5 degree F) from the late 1800s through about 1910.
- A warming of just less than 1 degree F from 1910 to 1940.
- A slow cooling trend of about 0.1 degree F from 1940 to 1970.
- A warming trend of about 1 degree F from the 1970s to the present.
Overall, Earth is getting warmer. A majority of the warming during the past century (about 0.7 degree F) has occurred since 1979 and over continents rather than oceans. Virtually all recent studies of global temperature trends suggest that the decade between 2001 and 2010 is the warmest in the historical record.
How do we know that recent warming is not just a result of natural variability?
Given the dynamic nature of the Earth’s climate system and known changes in Earth’s average temperature, the logical question about recent trends is, “How do we know that recent warming is not just a result of natural variability?” Climate scientists address this question using sophisticated computer models of global climate that allow investigation of the relative magnitude of temperature changes associated with various causes. These models also simulate the interactions between the atmosphere and the oceans and biosphere. The Intergovernmental Panel on Climate Change (IPCC) is a group of scientists who issue comprehensive assessments on climate science. In a recent report, they addressed this question of what is causing the recent warming trends. To do this, they tested more than 15 different global climate models at research laboratories around the world with two sets of conditions for the period 1906–20053.
1) Condition A: greenhouse gas concentrations held at a constant level (330 parts per million for carbon dioxide, reflecting only natural influences on the climate).
2) Condition B: greenhouse gas concentrations that increase over time (following observed changes, reflecting natural and human influences on the climate).
Scientists ran the climate models with these two sets of conditions and simulated the corresponding temperatures. These simulated temperatures were then compared to the real, observed temperatures that were recorded from 1906 through 2005. As can be seen in Figure 5, when computer models included natural and human influences (increasing greenhouse gas levels, Condition B), the simulated temperatures were in much better agreement with the observed temperature changes. These results are powerful for two key reasons: first, they increase our confidence that global climate models can accurately simulate the Earth’s climate system. Secondly, they suggest that much of the warming of the past two centuries is associated with increasing concentrations of greenhouse gases and not just natural variability. It is important to note that there is widespread scientific consensus on this: 97 percent of climate scientists agree that humans are increasing Earth’s temperature6,7.
The IPCC has concluded that “human-induced warming of the climate system is widespread” 3 , and that “continued greenhouse gas emissions at or above current rates will cause further warming and induce many changes in the global climate system during the 21st century that would very likely be larger than those observed during the 20th century” 4 .
What does this mean for the future?
Earth’s climate is a constantly changing, dynamic process. It has changed greatly in the past and will continue to change in the future. Through increased emissions of greenhouse gases into the atmosphere, human activity has resulted in a warming climate during the past few centuries. Depending on whether future greenhouse gas emissions stabilize or increase, we can expect warming of the planet similar to or greater than what has occurred in recent years. The projected global warming of 2 to 7 degrees F is very large by historical standards and could be the largest observed temperature increase in at least 50 million years8 . Even though that may seem like a small change, history proves that even small changes in the global average temperature can have an enormous impact. For example, the average global temperature at the end of the last glacial epoch (when Michigan was still largely covered by a thick sheet of ice) was only 9 to 11 degrees F cooler than that of today. As a rough analogy, if Michigan’s climate warmed 2 to 7 degrees F, it would be somewhat similar to the current and recent past climate across sections of the middle and lower Mississippi Valley (for example, southern Missouri or northern Arkansas).
Changes in climate already have affected us, and uncertainty remains about how we will adapt to future changes. However, we can stabilize our emissions through political and behavioral choices as well as with new technologies. By staying informed and engaging in dialogue about the changes we face, communities can create plans of action to reduce negative impacts, adapt to changes and take advantage of possible positive outcomes. (See MSU Extension Fact Sheet E3150).
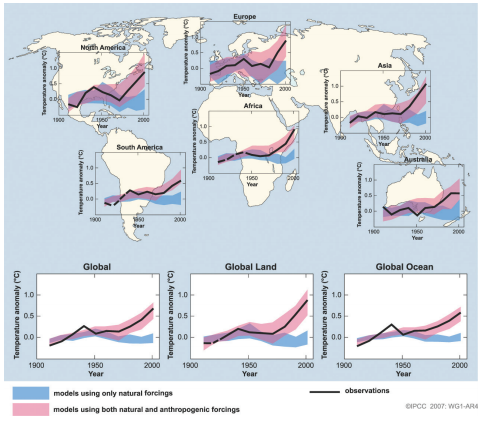
Figure 5: These figures show simulated changes in temperature (in degrees Celsius) during the 1906 through 2005 period relative to the 1901 through 1950 average over the Earth’s continents, the entire globe, global land areas and the global ocean. The black lines indicate observed temperatures; the colored bands show the combined range covered by 90 percent of general climate model simulations. The pink areas indicate simulations that include natural and human factors in the climate model (mainly the increasing greenhouse gases); blue indicates simulations that include only natural factors. Dashed black lines indicate decades and continental regions for which there are substantially fewer observations. These results suggest that the models that included human influences were more accurate in describing past observed temperature changes. (Figure from Hegerl et al., 20073 .)