


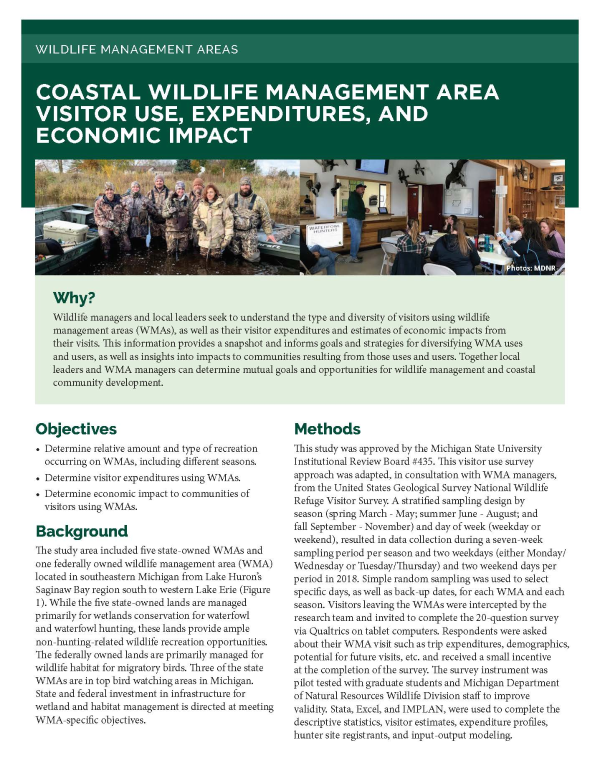
Coastal wildlife management area visitor use, expenditures, and economic impact
DOWNLOADSeptember 12, 2023
 Print
Print Email
EmailWhy?
Wildlife managers and local leaders seek to understand the type and diversity of visitors using wildlife management areas (WMAs), as well as their visitor expenditures and estimates of economic impacts from their visits. This information provides a snapshot and informs goals and strategies for diversifying WMA uses and users, as well as insights into impacts to communities resulting from those uses and users. Together local leaders and WMA managers can determine mutual goals and opportunities for wildlife management and coastal community development.
Objectives
• Determine relative amount and type of recreation occurring on WMAs, including different seasons.
• Determine visitor expenditures using WMAs.
• Determine economic impact to communities of visitors using WMAs.
Background
The study area included five state-owned WMAs, which included State Wildlife Areas (SWAs) and State Game Areas (SGAs), and one federally-owned National Wildlife Refuge (hereafter WMAs) located in southeastern Michigan from Lake Huron’s Saginaw Bay region south to western Lake Erie (Figure 1). While the five state- owned lands are managed primarily for wetlands conservation for waterfowl and waterfowl hunting, these lands provide ample non-huntingrelated wildlife recreation opportunities. The federally owned lands are primarily managed for wildlife habitat for migratory birds. Three of the state WMAs are in top bird watching areas in Michigan. State and federal investment in infrastructure for wetland and habitat management is directed at meeting WMA-specific objectives.
Methods
This study was approved by the Michigan State University Institutional Review Board #435. This visitor use survey approach was adapted, in consultation with WMA managers, from the United States Geological Survey National Wildlife Refuge Visitor Survey. A stratified sampling design by season (spring March - May; summer June - August; and fall September - November) and day of week (weekday or weekend), resulted in data collection during a seven-week sampling period per season and two weekdays (either Monday/Wednesday or Tuesday/Thursday) and two weekend days per period in 2018. Simple random sampling was used to select specific days, as well as back-up dates, for each WMA and each season. Visitors leaving the WMAs were intercepted by the research team and invited to complete the 20-question survey via Qualtrics on tablet computers. Respondents were asked about their WMA visit such as trip expenditures, demographics, potential for future visits, etc. and received a small incentive at the completion of the survey. The survey instrument was
pilot tested with graduate students and Michigan Department of Natural Resources Wildlife Division staff to improve validity. Stata, Excel, and IMPLAN, were used to complete the descriptive statistics, visitor estimates, expenditure profiles, hunter site registrants, and input-output modeling.
Results
A large share of WMA visitors traveled 50 miles or less to arrive at the site. During spring, the percentage of visitors that said they resided within 50 miles of the WMA ranged from 61-87%. The range for summer surveys was 42-96% and 40-83% for fall.
Spring |
Summer |
Fall |
|
| Average hours/trip | 2.47 | 2.28 | 4.1 |
| Returning visitors in last 12 months | 80% | 74% | 87% |
| Top social media use: Facebook | 58% | 64% | 64% |
| Average age | 49 years | 50 years | 45 years |
| Gender: Male | 85% | 76% | 95% |
| Completed college, technical school, graduate, or professional degree | 48% | 47% | 52% |
| Race: White | 82% | 85% | 90% |
| Annual household income before taxes and deductions >$57,000 | 53% | 51% | 74% |
Area |
Labor Income |
Regional Income |
Total Transactions |
| Fish Point WMA | $35,018 | $61,525 | $119,018 |
| Nayanquing Point SWA | $40,173 | $69,981 | $130,205 |
| Pointe Mouillee SGA | $112,223 | $181,966 | $341,203 |
| Shiawassee National Wildlife Refuge | $117,185 | $198,879 | $360,208 |
| Shiawassee River SGA | $36,326 | $61,323 | $110,913 |
| St. Clair Flats SWA-Harsens Island Unit | $47,940 | $80,987 | $150,685 |
Discussion
Key findings
Contacts
Dr. Barbara Avers
Waterfowl and Wetlands Specialist, Michigan Department of Natural Resources - Wildlife Division; Adjunct Assistant Professor MSU Fisheries and Wildlife Department
aversb@michigan.gov | (517) 930-1163
Dr. Heather Triezenberg
Associate Director and Extension Program Leader, Michigan Sea Grant, MSU Extension; Extension Specialist MSU Fisheries and Wildlife Department
vanden64@msu.edu | (517) 353-5508
ACKNOWLEDGEMENTS
We thank the participants in this research project. The results from this study would not exist without their willingness to share their perspectives. Funding for this research came from the U.S. Fish and Wildlife Service through the Pittman-Robertson Wildlife Restoration Act Grant MI W-155-R via a grant from the Michigan Department of Natural Resources, Wildlife Division. This study was prepared under awards NA140AR4170070, NA180AR4170102, NA17OAR4320152, and NA22OAR4170084 from the National Oceanic and Atmospheric Administration, U.S. Department of Commerce through the Regents of the University of Michigan. The statements, findings, conclusions, and recommendations are those of the authors and do not necessarily reflect the views of the National Oceanic and Atmospheric Administration, the Department of Commerce, or the Regents of the University of Michigan. These data and related items of information have not been formally
disseminated by NOAA and do not represent any agency determination, view or policy.
MSU is an affirmative-action, equal-opportunity employer, committed to achieving excellence through a diverse workforce and inclusive culture that encourages all people to reach their full potential. Michigan State University Extension programs and materials are open to all without regard to race, color, national origin, gender, gender identity, religion, age, height, weight, disability, political beliefs, sexual orientation, marital status, family status or veteran status. Issued in furtherance of MSU Extension work, acts of May 8 and June 30, 1914, in cooperation with the U.S. Department of Agriculture. Quentin Tyler, Director, MSU Extension, East Lansing, MI 48824. This information is for educational purposes only. Reference to commercial products or trade names does not imply endorsement by MSU Extension or bias against those not mentioned.
Accessibility Questions: