2019 farm financial benchmarking results for Michigan
 Print
Print Email
EmailUnderstanding farm financial trends has never been more important to the future success of a farm business.
There is an old saying, “Before you can see where you’re going, you have to know where you’ve been.”
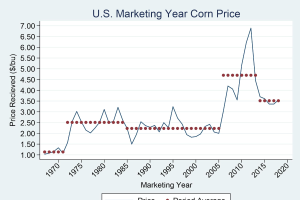
The past several years have been tough for Michigan farms. Challenges ranging from high ending stocks to impacts from foreign trade have caused lower prices across most commodities. These low prices resulted in low profits, making it difficult to cover cash flow needs, and limiting the growth of many businesses. The level of impact has varied widely between farm types and by individual farms. With additional market stress brought on by the novel coronavirus, understanding farm trends has never been more important to the future success of a farm business.
Where does a farm manager begin to start understanding these trends?
One place to look is in the 2019 Michigan Farm Business Summary report just released by Michigan State University Extension and the MSU Telfarm Program. The report is a collection of individual, in-depth farm analyses from all across Michigan. Not only does it provide a look at other types of businesses, it also offers insight into the market conditions that exist within similar industries.
For example, Michigan farms have seen a trend of declining profits since 2016 due to many of the economic challenges already mentioned. In 2019, these economic challenges were not only still present, but Michigan had the added impact of an overabundance of rainfall and flooding. This severe weather resulted in a significant number of operations taking advantage of preventative planting, which lowered potential revenues for many crop farms across the state. However, the report indicates that the average net farm income and cash flow margins for Michigan farms increased in 2019.
|
Table 1. Highlights of the Farm Business Analysis Report |
||||
|
|
2017 |
2018 |
2019 |
Vulnerable values |
|
All Farms |
||||
|
Net Farm Income |
$88,196 |
$49,912 |
$125,800 |
Less than living draws, taxes & principle payments |
|
Return on Farm Assets (FMV) |
1.5 |
0.3 |
2.4 |
Less than interest rate on borrowed funds |
|
Current Ratio |
2.02 |
1.96 |
2.25 |
Less than 1.3 |
|
Working Capital to Gross Income |
25.3% |
25.8% |
28.1% |
Less than 11.0% |
|
Farm Debt to Asset Ratio |
28% |
28% |
26% |
Greater than 60.0% |
What caused this to happen? A closer look at the report reveals that the farm enterprises within Michigan provide the answer.
|
Table 2. Farm Financial Performance Measures from Farm Business Analysis Report |
||||
|
|
2017 |
2018 |
2019 |
Vulnerable values |
|
Crop Farms |
||||
|
Net Farm Income |
$77,293 |
$144,619 |
$109,096 |
Less than living draws, taxes & principle payments |
|
Return on Farm Assets (FMV) |
1.7 |
2.8 |
2.0 |
Less than interest rate on borrowed funds |
|
Current Ratio |
2.1 |
2.0 |
2.3 |
Less than 1.3 |
|
Working Capital to Gross Income |
36.5% |
33.7% |
39.7% |
Less than 11.0% |
|
Farm Debt to Asset Ratio |
26.0% |
26.0% |
23.0% |
Greater than 60.0% |
|
Dairy Farms |
||||
|
Net Farm Income |
$142,861 |
$(38,078) |
$234,603 |
Less than living draws, taxes & principle payments |
|
Return on Farm Assets (FMV) |
2.3 |
-1.8 |
2.9 |
Less than interest rate on borrowed funds |
|
Current Ratio |
2.0 |
2.0 |
2.39 |
Less than 1.3 |
|
Working Capital to Gross Income |
18.6% |
18.6% |
18.7% |
Less than 11.0% |
|
Farm Debt to Asset Ratio |
29.0% |
28.0% |
29.0% |
Greater than 60.0% |
In 2019, the dairy industry saw as significant shift in both its net income and cash flow margin levels. With net farm incomes falling to negative levels in 2018, both the average net farm income and cash flow margins increased to positive levels in 2019. Several factors contributed to these increases, including higher cull sales, increased government payments, and an increase in the price of milk. The price of milk is the most noteworthy as the average price per cwt rose from $14.81 in 2018 to an average of $17.41 in 2019. This increase in revenue offset the reductions in both net farm income and cash flow margin experienced by crop farms.
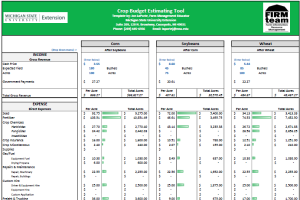
While this information is helpful in understanding market conditions, the real benefit is being able to compare against an individual’s own farm. To do this, MSU Extension recommends performing a financial analysis of the business. A financial analysis provides an in-depth look at where the operation is financially and provides the same information as seen with other farms in the report.
Performing a financial analysis also provides an opportunity to review the cost of production of the farm’s different crop or livestock enterprises. It allows operations to see what makes similar farms successful and understand where efforts to improve could begin. For example, the average land rent for all crop farms is calculated at $198 per acre. In comparison to the lower 33 percent of farms, land rent payments are calculated closer to $261 per acre. For farms with higher than average land rent payments, are there opportunities to reduce rental costs by reviewing rental agreements with landowners?
Finally, a financial analysis can help you determine how profitable the business is when considering borrowed debt. The rate of return on assets should be greater than the average interest rate on borrowed capital; so that interest is not eroding away the value of the farm assets. For instance, in 2019 the average rate of return on assets for grain farms was 2.4 percent. If the average interest rate on farm debt is 5 percent, then some of the farm equity returns were used to help pay loan interest expense.
For more information on performing a financial analysis, visit the MSU Telfarm website.