A new paradigm in milk marketing
In 2007 dairy producers entered a new era of higher milk prices and higher production costs.
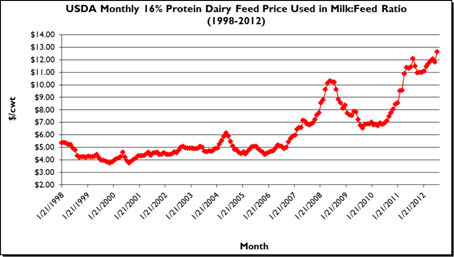
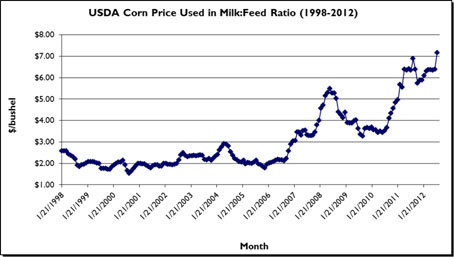
The USDA data used to calculate the milk:feed ratio undoubtedly shows dairy producers entered a new era insofar as feed prices are concerned beginning in 2007. Feed costs in the milk:feed ratio are calculated using three basic feeds: shelled corn, soybeans and alfalfa hay. The USDA blends 51 pounds of corn, 8 pounds of soybeans and 41 pounds of alfalfa hay to formulate a 16 percent protein mixed dairy feed. The cost of this hypothetical feed is expressed as dollars per hundredweight of feed. The data in Figure 1 dramatically show the increase in feed costs that began in 2007. The average price for the 16 percent feed from 1998 through 2006 was $4.63/cwt and rose to $8.68/cwt from 2007 to the present, a 87 percent increase. All three feeds used in the ratio increased in average price over these two time periods: corn, +119 percent; soybeans, +94 percent; and alfalfa hay, +54 percent. Figure 2 shows the corn price from 1998 to the present. The shape of the corn price curve is essentially the same for soybeans and alfalfa hay.
Also, Figures 1 and 2 make it clear the volatility of corn and feed prices also dramatically increased 2007-present as compared with 1998 - 2006. Using the standard deviation of prices as an indicator of volatility; the increase in volatility for corn prices jumped over 318 percent, soybeans up over 84 percent and alfalfa hay up over 223 percent. The volatility of milk prices also increased using the same measure (+57.3 percent). Thus, since 2007 feed prices are squeezing margins more tightly and the higher volatility of both feed and milk prices has increased risk as it concerns margin protection.
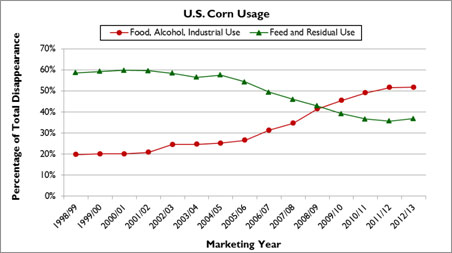
I don’t mean to oversimplify things, but I suspect a major reason for these changes, at least in the case of feed prices, is the effect the ethanol industry has had on corn usage and prices. Figure 3 shows the percentage of two categories of corn usage, “food, alcohol, industrial use,” and “feed and residual use,” both as a percentage of total U.S. corn usage. From the 1998/99 marketing year to the 2011/12 marketing year “food, alcohol, industrial use” rose from 19.8 percent to 51.6 percent of total use, while “feed and residual use” fell from 58.6 percent to 36.9 percent. This contributed, at least in part, to a 173 percent increase in the corn price.
Comparing these same two time periods (1998-2006 versus 2007-present) shows that the average USDA “All-milk” price climbed only about 24 percent. Data from Michigan State University also shows that the cost of producing milk on a subset of about 150 Michigan dairy farms averaged $15.56/cwt from 2003 - 2006 and rose to an average of $18.53/cwt from 2007-2010, about a 20 percent increase.[PD1]
My point is really quite simple: There has been a paradigm shift in feed costs, milk production costs and milk prices over the past several years both in terms of magnitude and volatility. Therefore, when formulating marketing plan for milk this needs to be considered. In the former era (1998 - 2006) lower price volatility meant risk was lower and not forward pricing feed or milk was less likely to negatively impact your farm business. However, the increased milk and feed price volatility post - 2007 has increased risk dramatically making the penalty for not forward pricing much higher. Can we say “2009”!
As a dairy producer, if you are planning to forward price milk using futures, options, forward contracts, gross margin insurance, or some combination of those tools, there are two decisions that are the most difficult. The first is “What is a good milk price?” The second decision is actually “pulling the trigger” and selling some milk. In my experience dairy producers have great difficulty in making both of these decisions.
How should you make these decisions? First you need to know your business. The two most important questions to answer are: “What is my cost of producing milk?” And, “How large is my financial risk?” Calculating your cost of production can be done with a fairly high degree of accuracy. I would advise calculating three versions: 1) what is needed to breakeven from a cash flow standpoint? 2) what is needed to cash flow and realize a reasonable return on assets? and 3) what is needed to cash flow, pay a reasonable return on assets and pay yourself for the value of your labor and management.
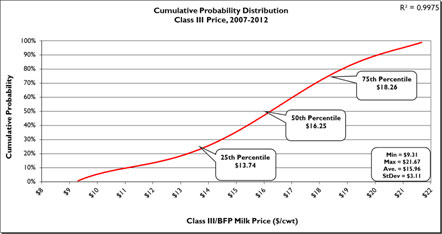
Next you need to look at the current milk prices being offered by the futures market. The most logical way to look at milk prices is to look at historical prices from a cumulative probability standpoint. Figure 4 shows a cumulative probability graph for announced Class III prices from 2007 to the present. The graph shows the average announced Class III price over that time period was $15.96/cwt, but was quite variable with a low of $9.31/cwt and a high of $21.67/cwt. The red curve shows the 25th, 50th and 75th percentile prices. For example, $18.26/cwt is at the 75th percentile. This means that from 2007 to the present 75 percent of the monthly announced Class III prices were lower than $18.26/cwt and only 25 percent were higher. By looking at current futures prices and finding at what percentile they fall you can gain some idea, from a historical standpoint, of whether or not that price is a “good” price. For example, on 9/25/12 the March 2013 Class III futures price settled at $19.21/cwt, which is at the 84th percentile. Thus, only about 16 percent of settled Class III prices from 2007 to the present were higher.
After making this determination it is important to look at the current market fundamentals (i.e., trends in milk production, commercial disappearance, dairy product inventories, imports, exports, etc.). (I put out a monthly Dairy Market Update that addresses these issues, send me an e-mail for a free subscription.) Once you have a handle on market fundamentals ask the question, “Are the current market fundamentals more likely to support higher or lower prices than the futures market is currently offering and how strong do the fundamentals support this price trend?” Now, look again at our example of the March 2013 Class III futures price of $19.21/cwt (as of 9/25/12) at the 84th percentile. It is a “high” price from a historical standpoint and it is likely that it will take strong market fundamentals to maintain this price and even stronger fundamentals to push it higher.
Next you should factor in your level of financial risk. In general, the more highly leveraged you are the greater your risk. In that case, you should consider forward pricing milk at a lower price as long as it allows you to meet cash flow needs. As your financial risk declines you are in a better position to accept more risk, thus, you may want to begin forward pricing milk at higher prices than the higher risk producer. Regardless of your level of financial risk, when futures prices are above the 80th percentile a producer should seriously consider marketing at least some of their milk production. When you forward price milk you should also lock in feed prices to insure margin protection. Pricing feed should follow a similar approach outlined for milk. Hopefully the new farm bill will broaden the applicability of margin protection insurance for dairy producers.
Unless drastic changes occur in the U.S. ethanol industry it is unlikely we will see a reversal of the trend of higher and higher feed prices and increased feed price volatility. Milk price volatility is also unlikely to decline as we move into the future. 2009 should have taught every dairy producer a lesson they should never forget. In 2009, due to the world financial crisis, our dairy export market was cut in half almost overnight. The U.S. dairy industry now depends on dairy exports to consume over 13 percent of total U.S. milk solids production. Our export markets have rebounded well from the fiasco of 2009, but that doesn’t mean they will never see a similar situation develop in the future. 2012 has also shown what can happen on the feed side of the equation with the effect this year’s widespread drought had on feed prices. The “take home” message should be crystal clear: price risk management for both feed and milk prices are more critical than ever.

Figure 1: USDA monthly 16 percent protein dairy feed price used in the milk:feed ratio.

Figure 2: USDA monthly corn price used in the milk:feed ratio.

Figure 3: Corn usage for “food, alcohol, industrial use” and “feed and residual use” as a percentage of total disappearance.

Figure 4: Cumulative probability distribution of Class III milk prices, 2007-present.


 Print
Print Email
Email


