Corn growth and maturity response to variable weather conditions
Uneven emergence and early season drought can prolong corn vegetative phase, delay maturity, and might impact grain yield and in-field moisture drydown.

The 2023 growing season in Michigan and other Midwest states has been unique and highly variable. In some places, early planting was possible in late April because soil had warmed sufficiently following a record warm third week of the month. However, the joy of early planting did not last long as a long period of drought began in April and persisted in many areas through mid-June. The drought resulted in uneven germination and stand establishment in many areas and has raised concerns among growers following normal or even cooler than normal weather during the second half of the summer season. The big question is: Will corn mature before the first frost, especially that fraction of the crop that was delayed by the early dryness? This article will summarize how early season drought affected phenology (corn emergence, vegetative and reproductive growth, and maturity). We will also report on the estimated fall frost date.
Effect of early season drought on corn emergence
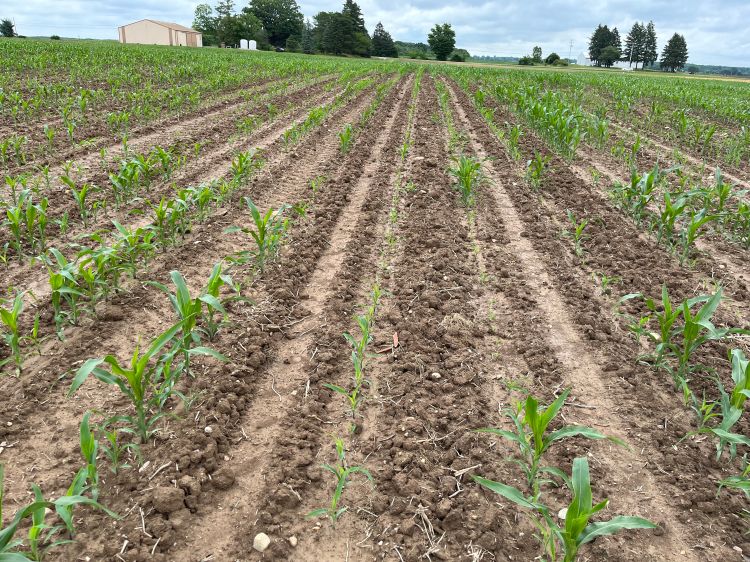
Adequate moisture is critical for corn germination and emergence. The seeds need to absorb about 30-35% of their weight to begin germination. Dry soils after planting in 2023 led to delayed and uneven emergence. For example, emergence in corn planted in our research plots between May 10 and May 30 on average was delayed by three days in 2023 compared to 2022. We also witnessed uneven emergence across trials and locations. Soil texture plays a role, with relatively greater impacts (more variability) on coarse textured soils which hold less water. Some growers planted deeper in search of optimal moisture, and this might have delayed emergence as well.
Effect of early season drought on vegetative growth
Drought stress during vegetative growth can reduce stem and leaf cell expansion. Severe drought stress can slow development and increase the time in vegetative stages. However, when drought is combined with heat stress, vegetative development progresses more rapidly. Other than the two several day warm episodes during the second week of May and near the end of May/early June Memorial Day weekend, early season temperatures in Michigan during the 2023 growing season were not significantly above normal (mean May and June temperatures statewide were generally within ± 1-2 degrees Fahrenheit of normal). Hence, corn did not experience heat stress for the most part and vegetative growth was slowed. Those early delays in turn have had more recent consequences on reproductive growth.
Effect of early season drought on silking
Drought stress delays silking time. We monitored the day of silking on a daily basis in our planting date trial during 2022 and 2023 (Table 1). Average silking date in 2023 was up to several days later than in 2022 across hybrid maturities and planting dates. For reference, a 99 relative maturity hybrid planted on May 10 started silking as early as July 14 in 2022. However, silking did not begin until July 20 in 2023 for the same hybrid and planting date. A recent United States Department of Agriculture Michigan crop progress report showed that 5% of corn planted in 2023 was yet to silk by the last week of August while 100% silking had been recorded at the same time last year. Delayed silking in 2023 can be attributed to the longer vegetative phase partially caused by the early season drought as well as delayed emergence. Delayed silking can affect corn maturity, grain filling time, moisture drydown and eventually yield and profits.
|
Table 1. Silking dates for three hybrid maturities planted at two different dates in East Lansing, Michigan. |
|||
|---|---|---|---|
|
Planting date |
Relative maturity |
Silking date |
|
|
2022 season |
2023 season |
||
|
May 10 |
94 |
July 17 |
July 22 |
|
99 |
July 18 |
July 25 |
|
|
104 |
July 17 |
July 24 |
|
|
May 30 |
94 |
July 28 |
Aug. 2 |
|
99 |
July 30 |
Aug. 3 |
|
|
104 |
July 29 |
Aug. 4 |
|
Implication of drought on corn maturity
The grain filling period takes about 60 days after silking/pollination to reach maximum grain weight and physiological maturity (black layer stage). At physiological maturity, corn is considered safe from frost. However, additional favorable environmental conditions are also necessary for adequate in-field kernel moisture drydown. Drydown rates are dependent on both the timing of the crop maturity as well as fall weather conditions. Extended periods (one week or more) of abnormally warm and dry weather during the falls of 2020 and 2022 at our East Lansing field trials resulted in observed drydown rates of 1% per day or more and significant savings for growers. Persistent cool and wet weather can have the exact opposite effect with additional input costs necessary for drying (as observed statewide in 2019). Regardless, during growing seasons with an extended vegetative period to silking, some hybrids might not reach maturity before frost occurs or might have high kernel moisture at harvest. It is therefore desirable to be able to estimate the date of corn maturity.
Estimating corn maturity: Useful to Usable tool (U2U)
The U2U tool is a public platform used to estimate corn phenology in the Midwest. This tool provides reasonable estimates; however, it does not account for a phenomenon called growing degree day (GDD) compression. GDD compression occurs following delayed planting in which corn development to black layer occurs with fewer GDD than would normally be required for a timely planted (and emerged) crop.
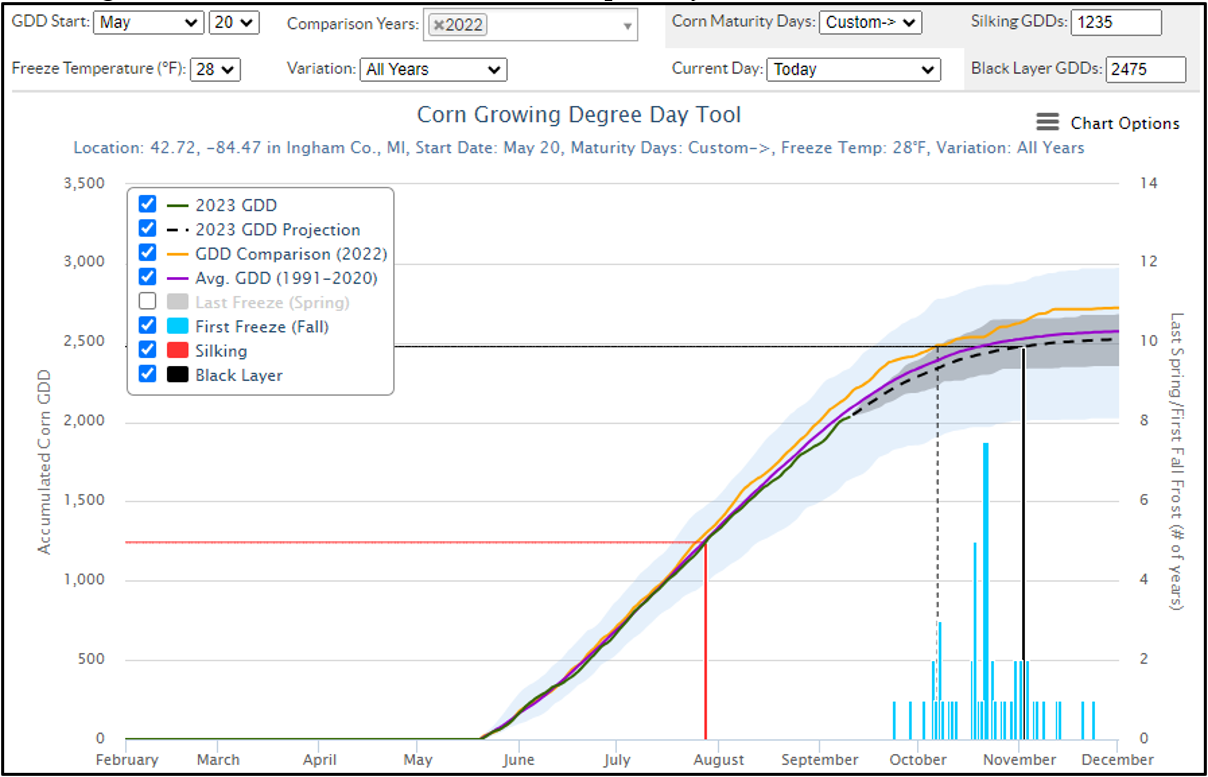
This phenomenon will likely be more pronounced this year because of delayed emergence and delayed silking time. Typical estimated physiological maturity for a 99 relative maturity hybrid planted on May 20 with the U2U tool is given in Figure 1 for a farm in Ingham County. Daily GDD accumulation in 2023 is given by the dark green trace (projected 2023 totals through the end of the season are given in the dashed black line based on climatology) and the climatological normal accumulation is in purple. GDD accumulation in the relatively warmer 2022 growing season (2.5 F warmer on average across Michigan for the four-month May through August period based on preliminary data) is included for comparison (orange trace). This output does not account for GDD compression. Overall, the 2023 accumulations generally lag behind the climatological normals (and the 2022 season), especially late in the season.

We have estimated GDD compression in 2021 and 2022 based on field trials with multiple planting dates and hybrid maturities. On average, a 99 relative maturity hybrid required 5.5 less GDD per day when planted after May 1 to reach black layer in 2021. In 2022, the same hybrid required 6.9 less GDD per day when planted after May 1. This number will likely be more pronounced this year because of delayed emergence and delayed silking time. Therefore, we used the 2022 compression number to demonstrate how to account for GDD compression in black layer estimation with U2U.
How to account for GDD compression in U2U:
- Obtain the estimated GDD to physiological maturity specified by the seed company. For our 99 relative maturity hybrid, it is 2,475 GDD.
- Estimate the average GDD compression based on planting date (after May 1). Assuming corn was planted on May 20, total GDD compression = 19 x 6.9 = 131 GDD.
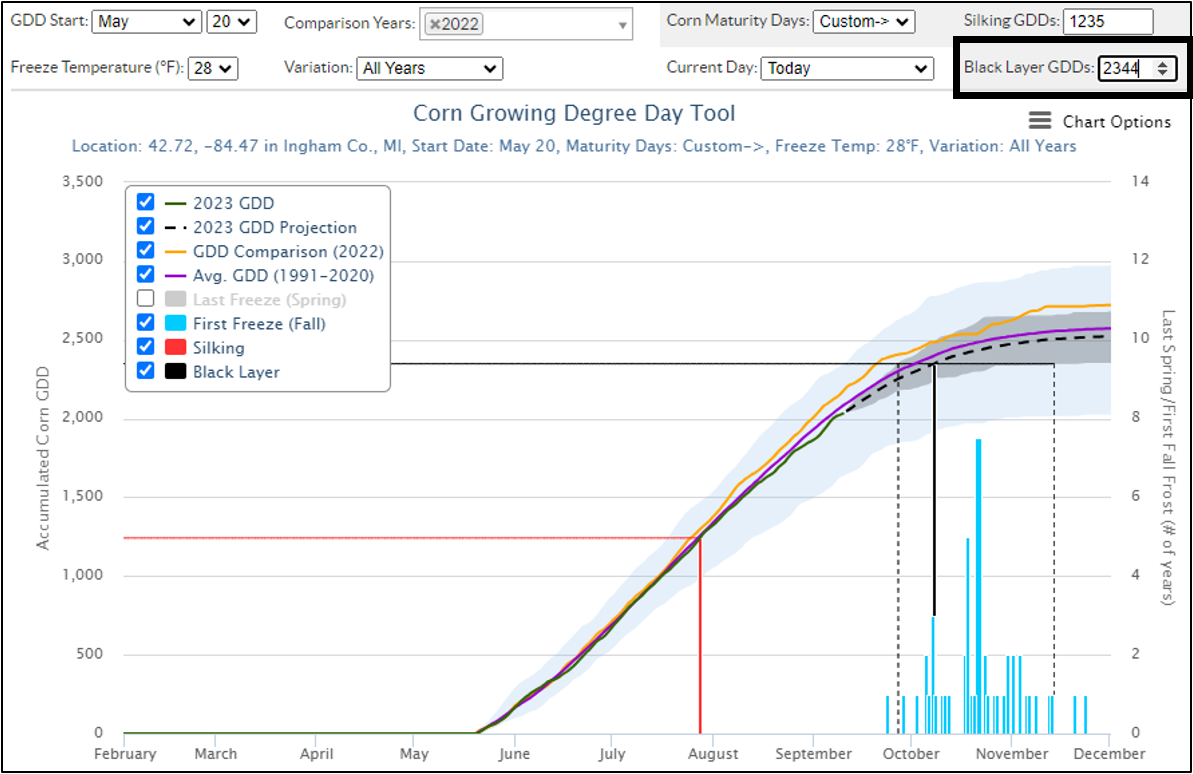
- Deduct the GDD compression from the total GDDs specified by seed company: 2,475 - 131 = 2,344 GDD
- Enter this new GDD in the “Black layer GDDs” box in U2U as done in Figure 2.
In Figure 1 (without GDD compression), the earliest black layer date is Oct. 7 with an average date of Nov. 2, suggesting that corn might not be able to mature before the first frost date of Oct. 23 in Ingham County (Table 2). In Figure 2 (with GDD compression), the earliest date is Sept. 27 with an average date of Oct. 8, suggesting corn maturity will occur ahead of the first frost date. It is important to mention that the final GDD numbers will differ significantly when you change the planting date, corn hybrid and environment.

Fall frost dates
Unfortunately, there is no accurate way to determine the date of first killing freeze (defined here as 28 F or lower) more than a few days in advance. For this reason, the best bet is to consider the climatology of an area and when first freezes have occurred in the past.
In general, about 80% of the first killing freezes occur within 15 days of the 50th percentile or median date (both ahead and after). Dates of first killing freeze of the season in Michigan vary by location. Statistics of first killing freezes based on climate observations from 1950-2021 are given in Table 2 for several representative counties across the state.
In general, the dates of first killing freeze are progressively later from north to south across the state and from interior areas of the state towards one of the Great Lakes (especially true in interior Upper and interior northern Lower Michigan). This table provides the median (50th percentile) value as well as the earliest and latest observed dates to give a range of dates when the freeze might be expected. If your county is not listed, you can get a good estimate for your own by considering the values of nearest listed counties and taking an average of those.
|
Table 2. Dates of first killing freeze (minimum temperature of 28 F or lower) in the fall season, 1950-2021. The earliest and latest dates are the earliest and latest observed dates during the period of record and the median is the observed 50th percentile, which can be used as an expected average date of occurrence. |
|||
|---|---|---|---|
|
County (north to south) |
Earliest date |
Median date (50th percentile) |
Latest date |
|
Iron |
Aug. 31 |
Sep. 27 |
Oct. 21 |
|
Menominee |
Sep. 13 |
Oct. 11 |
Nov. 10 |
|
Chippewa |
Sep. 21 |
Oct. 18 |
Nov. 10 |
|
Presque Isle |
Sep. 27 |
Oct. 23 |
Nov. 19 |
|
Grand Traverse |
Sep. 25 |
Oct. 22 |
Nov. 10 |
|
Clare |
Sep. 22 |
Oct. 15 |
Nov. 6 |
|
Saginaw |
Sep. 25 |
Oct. 25 |
Nov. 19 |
|
Huron |
Oct. 1 |
Oct. 28 |
Nov. 20 |
|
Kent |
Sep. 25 |
Oct. 21 |
Nov. 14 |
|
Ingham |
Sep. 26 |
Oct. 23 |
Nov. 19 |
|
St. Claire |
Oct. 5 |
Nov. 1 |
Nov. 23 |
|
Berrien |
Oct. 7 |
Nov. 2 |
Nov. 24 |
|
Branch |
Sep. 27 |
Oct. 23 |
Nov. 18 |
|
Monroe |
Oct. 1 |
Oct. 31 |
Nov. 21 |
If you have concerns on managing immature corn after making these maturity estimations, please read this article “Management guidelines for immature and frosted corn silage” from Michigan State University Extension.


 Print
Print Email
Email