Dairy market update, February 2013
 Print
Print Email
EmailDairy market fundamentals indicate dairy product and milk prices may not strengthen until mid-2013 as dairy cow numbers grow despite record culling.
Prices: On Monday, Feb. 25, 2013 spot prices for cheddar cheese blocks and barrels at the Chicago Mercantile Exchange (CME) were $1.6075/lb. and $1.6000/lb., respectively. CME block cheese prices are down since late Jan. (1/25/13) -$0.0375/lb. while barrels were up $0.0275/lb. During the same time period, butter is up (+$0.0650/lb.) to $1.5700/lb. The CME Class III futures averages (2/25/13) for 2013 were down (-$0.17/cwt.) to $17.81/cwt., the next 12 months was down (-$0.18/cwt.) to $17.78/cwt., and 2014 was up ($0.10/cwt.) to $16.50/cwt. These Class III futures averages correspond to potential USDA Michigan mailbox prices of $18.80/cwt. (2013), $18.77/cwt. (next 12-months), and $17.49/cwt. (2014). Figure 1 shows the current (2/25/13) CME Class III futures averages for 2013, the next 12-months, and 2014 are at the 66th, 66th and 50th percentiles, respectively.
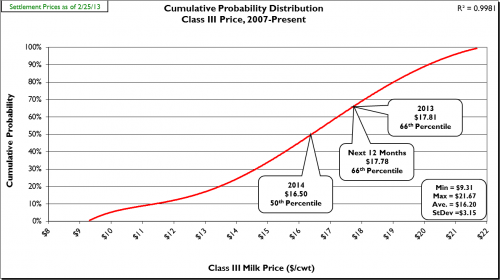
Figure 1: Cumulative probability graph of USDA announced Class III prices (2007-present) and current CME Class III futures averages.
Supply: In January, U.S. milk production rose 0.5 percent as compared with Jan. 2012. This was below trend increase (+1.5 percent, 2007-2011), but it must be remembered Jan. 2012 milk production was +3.8 percent as compared to Jan. 2011. Jan. marked the seventh time in the past eight months milk production grew below trend (+1.5 percent, 2007-2011). Jan. production in Michigan increased 3.1 percent compared with Jan. 2012. The size of the U.S. dairy herd continues to grow as dairy cow numbers increased by 7,000 head Dec. to Jan. and is up 36,000 head since last October. However, cow numbers in the major western dairy states (AZ, CA, NM, WA, and ID) continue to lag by 17,000 head as compared with Jan. 2012. Nationally cow numbers are down by 17,000 head compared with Jan. 2012. Dairy cow slaughter numbers in 2012 ran well ahead of 2011, up 187,200 head, and Jan. was up 33,100 head as compared with Jan. 2012 was at an amazing 38.6 percent. Average cull cow prices have softened a bit, but remain historically high at $79.50/cwt. (+6.6 percent compared with Jan. 2012). Milk production per cow in 2012 grew above trend (+1.4 percent, 2007-2012) at +1.6 percent. Most of that growth occurred in the first six months (+2.3 percent) as compared to the last six months (+0.5 percent) as a combination of hot summer weather, high feed prices and lower quality forages took their toll. The USDA reports an increase in dairy feed prices in Jan. of +14.6 percent compared with Jan. 2012. The Jan. milk:feed ratio, at 1.58, was below 2.00 for the 26th time in the past 28 months.
Demand: Total commercial disappearance of dairy products for 2011 finished the year right at trend increase (+1.5 percent, 2007-2011). So far for CY-2012 (Jan.-Nov.) total commercial disappearance was up 1.8 percent. Total commercial disappearance set all-time monthly records Jan.-March, May-Aug. and October; however, Sept.-Nov. was down (-0.3 percent) compared with Sept.-Nov. 2011. The Jan. through Nov. disappearance of individual dairy product categories was: American cheese, +1.9 percent; other cheese, +2.2 percent; nonfat dry milk, +21.4 percent; butter, +2.7 percent; and fluid milk, -1.5 percent.
U.S. dairy trade has shown trade surpluses for thirty five consecutive months. For Dec., U.S. dairy exports were valued at $419.9 million, down 2.3 percent from Dec. 2011. Dec. marked the twenty second consecutive month exports exceeded $400 million, but broke a string of thirty two consecutive month exports equaled 12-15 percent of total U.S. milk solids production. Dec. exports equaled 11.6 percent of total U.S. milk solids production while CY-2012 equaled 13.2 percent (as compared to 13.3 percent for CY-2011). For CY-2012 U.S. dairy exports accounted for 45 percent of nonfat dry milk/skim milk powder produced in the U.S., 5.3 percent of cheese, 5.5 percent of butter; 47 percent of dry whey, and 66 percent of lactose. Aggregate CY-2012 dairy export sales were +3 percent in volume and +8 percent in value vs. CY-2011, despite volume and value down by almost 10 percent in the second half of the year.
Dairy Product Inventories: The latest USDA Cold Storage Report showed inventory increases in Jan. for American cheese (+0.2 percent, 643.5 million pounds) and total cheese (+1.2 percent, 1,032.3 million pounds) as compared with Jan. 2012. Jan. marked the second consecutive month total cheese inventory was above 1.0 billion pounds. Jan. butter inventory was 21.3 percent above Jan. 2012 at 206.6 million pounds, marking the sixteenth consecutive month butter inventory was above the same month last year.
Outlook: Dairy markets remain in somewhat of a holding pattern since late Jan. as U.S. as milk production growth remains at or below trend for seven of the last eight months. Dairy cow numbers continue to climb (increase of 7,000 head Dec. to Jan. and 36,000 head October to Jan.) despite record cull rates. The total slaughter number for Jan. (296,000 head) was the highest monthly total since 1986, the year of the whole-herd buyout. Total U.S. replacement heifer numbers are down as compared to last year so replacement heifer prices should strengthen.
The highest cull rates are in the western dairy states (AZ, CA, NM, WA, ID) with cow numbers down 17,000 head compared with Jan. 2012. Typically those states run 30,000 to 50,000 head above last year on a regular basis. Industry reports indicate very difficult times continue to plague the California dairy industry. A major dairy accounting firm in California reports that “…10 percent of their firm’s clients sold out in the past year or two, while another 20 percent-30 percent have filed for bankruptcy.” And a recent story in the San Francisco Chronicle reported that more than 100 California dairies are facing bankruptcy, foreclosure, or sale by year’s end (2012).
USDA measured feed prices were higher in Jan. than last year (+14.6 as compared to Jan. 2012). On the CME feed prices are mixed over the past month with corn down ~50cents/bu and soy up ~80cents/bu. Forage prices are at historical highs as heat, drought, and reduced hay acreage played havoc with hay and corn silage production in 2012. The USDA reported U.S. average alfalfa hay price was at $217/ton for Jan. A recent USDA report also showed nationwide alfalfa/alfalfa mixed hay production down 15.0 percent (Michigan was down 17.5 percent); the lowest production since 1953. Much of this decline is due to planting decisions and is unlikely to change the hay outlook very soon. Weather forecasters are mixed in the long range forecast for 2013. However the latest drought monitor map indicated moderate to exceptional drought conditions in nearly 56 percent of the lower 48 states, especially in the Plains and High Plains states. If 2013 is even a near repeat of 2012 insofar as crop moisture conditions are concerned, feed prices will be making headlines once again. Feed prices, quality, and availability; along with continued high cull prices and cull rates, should keep cow numbers, milk per cow, and total milk output below trend well into 2013 and support stronger milk prices, especially during the second half of the year.
The consumer confidence index fell to 58.6 in Jan. down from 66.7 in Dec. and 73.7 in Nov., far short of the 90 level which is indicative of a healthy economy. One expert is forecasting restaurant traffic in the U.S. to pick up by 3 percent in 2013, but average spending per meal is forecast to drop 4.7 percent as consumers cope with the weak U.S. economic recovery. It is important to remember that more than 45 percent of cheese consumption occurs outside the home. Total commercial disappearance figures for Jan.-Nov. are at trend (+1.8 percent) and set all-time monthly records for Jan.-March and May-Aug. and Oct. However, the recent growth in cheese and butter inventories is probably indicative of slumping consumption (-0.3 percent, Sept. to Nov. for total commercial disappearance) as it is of increased milk production. Over the next few weeks some strengthening of cheese and butter prices is possible with the onset of the Passover/Easter/spring break dairy product sales season. However, due to low consumer confidence, strong spring holiday sales are not certain as they are always predicated on an increase in travel and meals eaten outside the home.
Overall the U.S. dairy export market remains strong, but did show signs of weakness in the latter half of CY-2012 (down ~10 percent vs. the first half of the year). Milk production by all the major exporting countries; New Zealand, Australia, the EU and U.S., are forecast to grow by less than +1.0 percent in 2013. During the first part of 2013 the international market will be absorbing the strong 2012 spring flush from Oceania, however, there are no significant stores of finished product stocks in the U.S. or the EU to buffer markets as we move into mid-2013. International demand of dairy products is forecast to remain strong, for example, China is forecast to increase dairy exports 14 percent in 2013. Therefore, as long as prices don’t get too high (i.e., >$20 U.S. Class III price) we should be able to get U.S. dairy exports back into the 13-14 percent of total U.S. milk solids production range.
Look for the block/barrel average cheese price to strengthen into mid-March to perhaps $1.75 then fall back to ~$1.60 as the spring milk production flush picks up steam in April. There is a good chance of stronger dairy product prices in summer and fall of 2013 since U.S. milk production growth should remain below trend for the foreseeable future. Butter prices could show some strength as Passover/Easter approaches and as increasing amounts of cream move to ice cream production. The Passover/Easter/spring break season usually stimulates stronger butter and Class II product sales at a time when the ice cream industry gears up to build inventory for summer sales. Therefore, butter prices may top $1.75 again by mid-March. In the longer term look for 2013 average dairy product and milk prices to be very close to the high end of the current USDA forecast.
Producers should sharpen their pencils, calculate their latest cost of production and formulate their 2013-14 milk and feed marketing plan. The market consistently shows it is impossible to sustain Class III prices in the $20+ range for any length of time as both domestic and export commercial disappearance are negatively affected. So, don’t wait hoping for consistent $20+ Class III prices. The USDA is forecasting record acreages of corn and soybeans for 2013 and a return to trend yields. Based on these assumptions, USDA economists are forecasting $4.80/bu corn and $10.50/bu soybeans for the 2013 crop. Sounds great, but what if those predicting a repeat of 2012 crop moisture conditions are correct? This uncertainty makes the development of a milk and feed marketing plan even more critical. Remember: marketing is first about price risk management and secondarily about profit enhancement. Work at increasing your overall average milk price rather than trying to hit the market high. A narrated PowerPoint presentation based on this report is available on my website by clicking on the “Narrated PowerPoint” button.