Dairy Market Update, September 2011
 Print
Print Email
EmailDairy market fundamentals and prices are weakening and a great deal of risk remains in the market.
Prices: On Friday, September 23, 2011 spot prices for cheddar cheese blocks and barrels at the Chicago Mercantile Exchange (CME) were $1.7275/lb and $1.7075/lb, respectively. CME block and barrel cheese prices are mixed since late August (8/30/11), -$0.0625/lb and +$0.0025/lb, respectively. During the same time period, butter plunged (-$0.3200/lb) to $1.7700/lb. CME Class III futures averages (9/23/11) for 2011, the next 12 months, and 2012 were down substantially to $18.14/cwt (-$0.12/cwt), $17.19/cwt (-$0.68/cwt), and $16.88/cwt (-$0.16/cwt), respectively. These Class III futures averages correspond to potential USDA Michigan mailbox prices for 2011, the next 12 months, and 2012 of $19.13/cwt, $18.18/cwt, and $17.87/cwt, respectively. Figure 1 is a cumulative probability distribution of all USDA BFP/Class III monthly prices from 1995-present. The figure shows the current (9/23/11) CME Class III futures averages for 2011, the next 12 months, and 2012 are at the 92nd, 89th, and 87th percentiles, respectively.
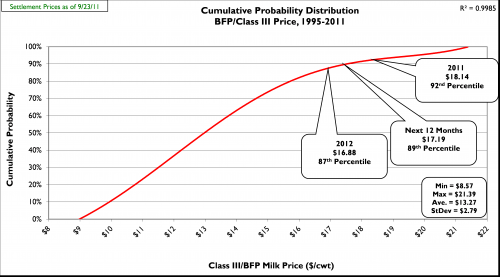
Figure 1: Cumulative probability graph of USDA announced monthly
BFP/Class III prices (1995-present) and current CME futures averages.
Supply: In August U.S. milk production increased above trend (+1.6%, 1995-2011) at +2.1% compared to August 2010. August was the first time since March that milk production grew above trend increase. August production in Michigan increased +2.4% compared to August 2010. The size of the U.S. dairy herd grew by 2,000 head July to August, and is up 94,000 head versus August 2010. Dairy cow slaughter numbers in 2011 continue to run well ahead of last year, up 82,100 head compared to last year (through 9/03/11). Average U.S. cull cow prices remained very high in August at $71.10/cwt (+22.0% compared to August 2010). Milk production per cow for January through August was below trend increase (+0.7%); however, the August increase was the highest in four months. The USDA reported an increase in dairy feed prices in August of 64.5% compared to August 2010; however, income over feed costs were up 15.8% (+$1.16/cwt) due to an increase of $5.30/cwt in the “All-milk” price.
Demand: The USDA reports total commercial disappearance in 2010 increased 3.3% over 2009, well-above the 1995-2009 average increase (+1.6%). All categories of wholesale dairy products showed above trend increases in disappearance for 2010 except fluid milk products. Total commercial disappearance for 2011 has weakened and only stands at trend increase (+1.6%) through June. All-time monthly records were set for January, February, March and April, but May and June were down 1.4% and 3.2%, respectively, as compared with May and June 2010. Through June, disappearance of individual product categories was: American cheese, +3.5%; other cheese, +6.1%; nonfat dry milk, -4.6%; butter, +14.4%; and fluid milk, -1.4%.
U.S. dairy exports for 2010 totaled $3.71 billion, up 63% from 2009. U.S. dairy imports in 2010 were the lowest since 1997. U.S. dairy exports continue strong in 2011 with January, February, March, April, May and June totaling $335 million, $348 million, $421 million, $403 million, $401 million and $429 million; +49%, +55%, +42%, +40%, +40% and +22% compared to January, February, March, April, May and June 2010. January through June 2011 exports were equivalent to 13.1% of total U.S. milk solids production, while imports were equivalent to only 2.7% (the lowest since 1996). In the first six months of CY-2011, exports accounted for 48% of NFDM/SMP produced by the U.S., 5.0% of the cheese, and 9.4% of the butter. So far in FY-2011 (Oct-Jun), U.S. dairy exports are valued at $3.346 billion (+37% versus FY-2010) with a dairy trade surplus of $1.196 billion.
Dairy Product Inventories: The latest USDA Cold Storage Report showed an inventory increase in August for American cheese (+1.3% at 641.8 million lbs.) and an increase for total cheese (+0.02% at 1,059.1 million lbs.) compared to August 2010. American cheese inventories set all-time monthly highs for each of the months from January through May, and July and August. Total cheese inventory set monthly records for all months January through August. Furthermore, the June to July increase in American cheese inventory (+29.4 million pounds) was the highest in seven years. August butter inventory was 6.7% above June 2010, marking the first time in eighteen consecutive months butter inventory was above the same month in the previous year.
Outlook: Wholesale dairy product prices are mostly lower. CME Class III futures prices are lower with price averages promising to drop even more beginning in 2012. The 2011, next 12-month and 2012 price averages declined (-$0.1192/cwt, -$0.6842/cwt and -$0.1558/cwt, respectively). Milk production appears to have rebounded from the summer heat in most areas of the country with milk per cow in the U.S. up 1.1% in August versus August 2010. U.S. total milk production in August was up 2.2% which was only the second time this year total milk production increased at or above trend (+1.6%). Dairy product commercial disappearance suffered greatly in May and June down 1.4% and 3.2%, respectively versus the same months in 2010 despite record dairy product exports. Consumer confidence has tanked since February and the outlook for the all-important fall dairy product sales season is now quite pessimistic. CME cheese prices had a 58 trading day run in excess of $2.00 per pound. All schools are now open which shifts significant amounts of manufacturing milk into the Class I market and normally measurably increases mozzarella consumption. However, this has had little if any positive effect on our currently weak cheese market. If the fall holiday sales season is not robust look for cheese and butter prices to continue their recent decline. This will obviously translate into lower Class III and IV prices. I was hopeful that we would see cheese prices at least temporarily recover this fall to the mid $1.90’s. Now I am pessimistic this will happen and have dropped my hopes to the mid $1.80’s. If this materializes I would expect it to be quite brief and encourage producers to consider selling some milk if we see such a rally. Don’t make the mistake of becoming anchored to the high prices we experienced this summer and place too much hope in them returning in the near future.
Even though feed prices are higher, margins for dairy producers have improved over last year (August income over feed cost +$1.16/cwt versus August 2010). High feed costs, high cull cow prices, and increasing replacement cow prices should keep growth in milk per cow below trend rate for the rest of 2011. However, we now have 9,217,000 dairy cows in the national herd which can result in above trend growth in total milk output even though milk per cow remains below trend. As milk prices slide lower margins for dairy producers will tighten. Past history has universally shown us that when this occurs the U.S. dairy industry increases milk output as producers seek to keep enough cash flowing through their businesses to pay bills. The U.S. dairy export market remains very strong, but there is much risk in the future outlook given all of the economic problems abroad and here at home. The economic crisis of 2009 showed how quickly export markets can decline. I don’t look for any of the major dairy exporting regions (Oceania, EU, South America) to decisively reduce the U.S. share of the world dairy market. However, I am concerned that another economic crisis could quickly put the U.S. dairy producer back into the dark days experienced in 2009. I advise dairy producers to keep a sharp eye on world economic developments and market milk into 2012 and 2013 accordingly.
To view a full report and other dairy marketing information go to my web site at: www.msu.edu/~thomasc. This site also features a narrated Dairy Market Update PowerPoint presentation. Both of these reports will be updated in early October. For assistance in calculating your cost of production send me an e-mail request (thomasc@anr.msu.edu).