


Early firing symptoms and end of season stalk nitrate test for corn
 Print
Print Email
EmailCorn fields with N deficiencies are showing early firing symptoms. Consider the end-of-season stalk nitrate test to check effectiveness of your nitrogen practices.
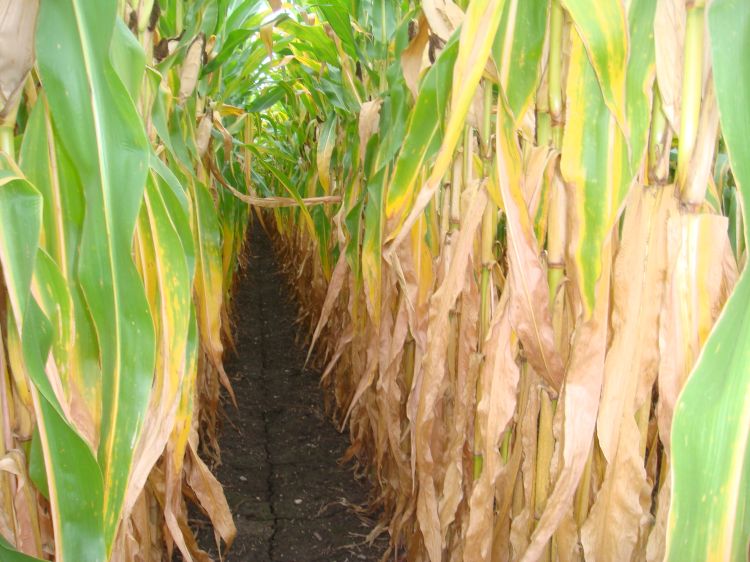
With above normal rainfall favoring early season nitrogen (N) losses, we are starting to see corn fields with typical N deficiency symptoms. When N deficiencies occur early and mid-season, corn leaves on the lower part of the plant begin to turn yellow prematurely starting from the leaf tip and progressing towards the stalk (Photo 1). Lower leaves will be affected first as N is reallocated to the upper leaves. The yellow color will turn brown followed by death of bottom leaves, a condition known as early firing (Photo 2). This year, even plots that received 240 pounds per acre in a split application, are showing deficiency symptoms. Sandier ground that received all or most of the N before or at-planting shows the highest tendency to early firing.
The nitrate N concentration in the lower portion of the corn stalk is a good indicator of the N status of the crop. As corn approaches maturity, plants stressed for N will move N from the lower cornstalk to the ear, resulting in a low stalk nitrate concentration. When corn plants have more than sufficient N for maximum yield, nitrate N accumulates in the lower stalk.
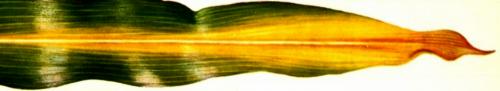
Photo 1. Progression of typical N deficiency symptoms in the leaf.
The end-of-season cornstalk nitrate test is a useful diagnostic tool to assess the adequacy of N during the season (Photo 3). The methodology and interpretation of this test were discussed in a previous Michigan State University Extension article “End of season corn stalk nitrate test.” The portion sampled is the 8-inch segment of stalk between 6 and 14 inches above the soil.
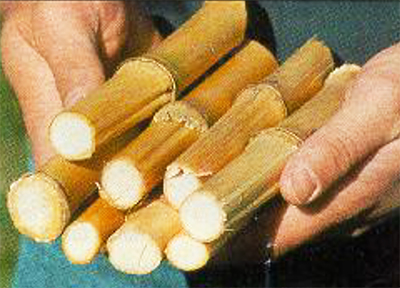
Photo 3. End-of-season corn stalk samples.
The stalk nitrate N levels are divided into three broad categories: low range (less than 450 ppm), optimal range (450 to 2000 ppm) and excess range (greater than 2000 ppm). The low range indicates an N shortage situation, and often is associated with visual deficiency symptoms described above. The optimal range indicates N availability that corresponds to maximum economic returns. The excess range indicates N availability greater than required for maximum economic returns.
One obvious advantage is that this test does not require in-field N reference strips such as the ones needed for chlorophyll meter test. The broad range of nitrate-N in each category is meant to accommodate some of the differences due to hybrids, soil types and weather. The test has a few limitations. The test is performed at the end of the season, so it does not provide any remedy for the current year, nor does it accurately tell you how many pounds of N were over applied or under applied. The time of sampling also is very critical. It is two to three weeks after physiological maturity or black layers have formed on 80-90 percent of the kernels. At this stage, most leaves and stalks have turned to brown color and mobilization of N to the kernels has ceased. Sampling should avoid planting skips and stalk rots.
Familiarity with the data over a number of years, covering a wide range of weather conditions, should assist in fine-tuning the N fertilizer rates on a field-by-field basis. Fields that are consistently in the excess range are often associated with over application of N fertilizer or animal manures. With corn prices declining and fertilizer prices rising, this test is a useful tool in the repertoire for improving N fertilizer management.
Corn stalks from field areas with different soil types or management zones ideally should be sampled separately. Many Michigan private soil testing laboratories will perform this test. The MSU Soil and Plant Nutrient Laboratory charges $12 per sample.
Michigan State University Extension’s recommendation is to split the N so that about one-third is applied at planting and two-thirds is sidedressed around the V6 stage. This will help to increase net returns to fertilizer investment by reducing N losses.
To see the latest N management research at MSU, growers are encouraged to attend the 2015 Nutrient Management Update and Plot Tour on Sept. 9. The timing and placement of N and the use of N inhibitors will be discussed. Starter and pop-up fertilizer placement will be demonstrated. Please visit http://events.anr.msu.edu/NMU for online registration.