Get meaningful, reliable results from your on-farm research trials
Sound experimental design followed by the use of proven statistical analysis can help producers reliably evaluate new products, practices or equipment on their farms.
New products, practices and equipment are continually being introduced to agricultural producers. Evaluating the new products, practices or equipment in on-farm research trials is an excellent way to determine how well they actually perform. Producers will often evaluate new products, practices and equipment by comparing them side by side in two strips or by splitting a field in half. This practice introduces a tremendous amount of experimental error and does not produce reliable information regarding the performance of the product, practice or equipment. The information generated is heavily influenced by factors other than the practice or product being evaluated. Good experimental design followed by careful statistical analysis can eliminate much of the experimental error and help producers determine the actual performance of the new practice, equipment or product.
Developing and implementing a sound experimental design is the first step to generating meaningful and reliable results from on-farm research trials. One of the most common and effective designs is called the Randomized Complete Block Design (RCBD). The RCBD is also one of the easiest to layout in the field. The RCBD reduces the experimental error by grouping or blocking all of the treatments to be compared within blocks or replications. This design improves the likelihood that all the treatments are compared under similar conditions. Blocking the treatments together and replicating the blocks across the field is a simple and effective way to account for variability in the field. Increasing the number of blocks generally increases the sensitivity of the statistical analysis by reducing the experimental error. The Soybean Management and Research Technology (SMaRT) program encourages cooperators to use four blocks or replications.
Another important aspect of a good experimental design is the concept of randomization. Randomly assigning the order of the treatments within each block is critical to removing bias from treatment averages or means and reducing experimental error. Figure 1 shows the actual RCBD design that was used for the 2011 SMaRT soybean planting population trials. It demonstrates the principles outlined above. Note how each of the four planting populations (120,000; 140,000; 160,000; and 180,000) is included and randomized within the blocks or replications.
Figure 1. The Randomized Complete Block Design used for the 2011 SMaRT soybean planting population trials.
| 120 | 160 | 180 | 140 | 180 | 120 | 140 | 160 | 120 | 160 | 140 | 180 | 140 | 120 | 180 | 160 |
| Replication 1 | Replication 2 | Replication 3 | Replication 4 | ||||||||||||
After the trial is harvested, proven statistical methods are used to determine if the differences in yields are due to the treatments or a result of other outside factors. It is important to look at two figures as you interpret the information contained in the tables and graphs printed in on-farm research publications: Coefficient of Variation (C.V.) and the Least Significant Difference (LSD 0.05)
Coefficient of Variation (C.V.)
This expresses the variation in the trial that is not attributable to the treatments as a percentage. The coefficient of variation is commonly less than 10 percent in reliable on-farm research trials.
Least Significant Difference (LSD 0.05)
This is normally expressed at the 95 percent confidence level. The LSD0.05 is a calculated figure that producers can use to determine with a confidence level of 95 percent that the yield difference between two or more treatments is due to the treatments and not other factors.
For example, if the LSD 0.05 is 2 bushels per acre and the average yield for the new product or practice being evaluated was 55 bushels per acre, and the average for the untreated control was 54 bushels per acre, the difference in yield cannot be attributed to the treatment with 95 percent certainty. Therefore, the difference between the two yields is not statistically significant.
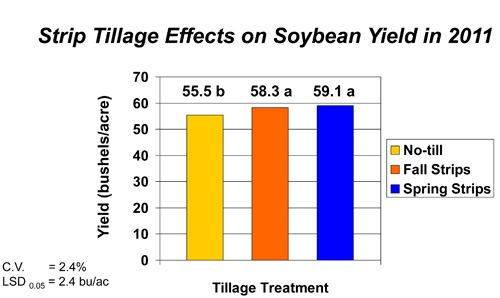
 Letters are commonly used in the tables and graphs in MSU Extension publications and presentations to identify yields or other measurements that are, or are not, statistically different from one another. When the same letter appears next to the yield or other measureable condition of two or more treatments, the difference between them is not statistically significant. An example of this is given in the figure to the right.
The SMaRT program designs and analyzes on-farm research trials enabling Michigan soybean producers to reliably evaluate the performance of new products, equipment and practices on their farms. In many cases, a given trial like planting populations is conducted at multiple locations and over multiple years. This greatly improves the reliability of the information produced.
If you would like to conduct a soybean research project on your farm in 2012, please contact Mike Staton, MSU Extension soybean educator, by phone at 269-673-0370 ext. 27 or by email before March 1.


 Print
Print Email
Email


