Lessons learned from the Michigan Soybean Yield Contest years 2006-2011
Management information collected from six years of the Michigan Soybean Yield Contest can help producers identify opportunities for increasing soybean yields on their farms.
The Michigan Soybean Yield Contest was an important part of the Soybean 2010 project and will continue to be part of the new Soybean Management and Research Technology (SMaRT) program. The contest has encouraged soybean producers to use proven recommendations as well as to explore new management practices and products in the pursuit of higher soybean yields. The entrants recorded their management practices and provided this information to the SMaRT program with the goal of identifying management practices and products that contribute to higher yields. This article summarizes some of the information collected from contestants from 2006 through 2011.
We collected information about management practices from 200 entries over the six years of the contest. This information was entered into a spreadsheet, sorted and summarized. To identify key differences between the high-yield producers and the low-yield producers, we compared the management practices of the top five non-irrigated entries to the bottom five non-irrigated entries from each year. We focused on non-irrigated entries in this comparison as the vast majority of Michigan soybeans are grown without irrigation. The average yield for the high-yield group (30 entries) was 71 bushels per acre and the average yield for the low-yield group (30 entries) was 45 bushels per acre. The summarized information has not been subjected to statistical scrutiny. However, general trends and observations are still valuable and worth considering. Soybean producers can use the information gathered from the Michigan Soybean Yield Contest to identify and prioritize opportunities for improving soybean yields on their farms.
Differences between high- and low-yield producers
Some management practices were obviously different between the high and low-yield producers. These are discussed below.
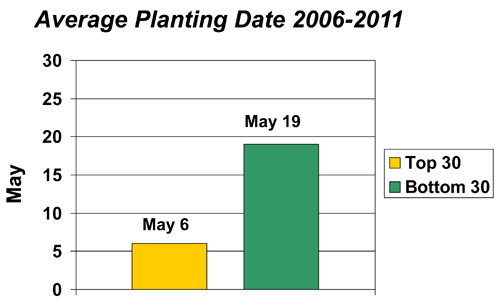
Planting date. Early planting is one of the most commonly cited management practices for increasing soybean yields. The average planting date for the high-yield producers was May 6, which was 13 days earlier than the average planting date for the low-yield producers. Research from the University of Wisconsin showed that soybean yield losses of 0.4 of a bushel per acre per day occur when planting is delayed past the first week of May. Sixty-six percent of the high-yield entries were planted by May 8 compared to only 27 percent of the low-yield entries. This trend held true even in 2011 despite the wet planting season. The average planting date for the top 17 contestants in 2011 was May 13 compared to May 25 for the bottom 17. Dr. James Specht, professor at the University of Nebraska, found that early planting increases soybean yields by creating larger plants during the vegetative stages that are able to utilize more of the available sunlight and soil moisture. He also found that early planted plants have more main stem nodes. More stem nodes increases the potential for more pods to develop. The high-yield producers averaged 49 pods per plant at harvest compared to 40 pods per plant for the low-yield group.
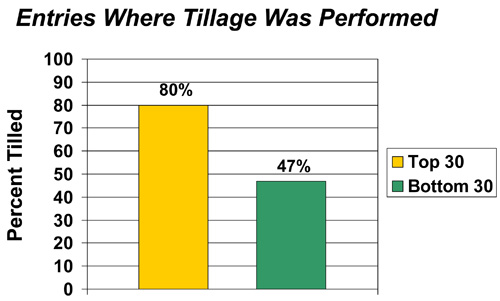
Tillage. A larger percentage of the high-yield producers used tillage implements to prepare the soil prior to planting soybeans. This trend may be partially explained by the fact that their entries were planted on finer textured soils which are known to respond to tillage to a greater extent than coarse-textured soils. The average cation exchange capacity for the high-yield entries was 12 meq/100g compared to 9 meq/100g for the low-yield entries. The high-yield group averaged fewer passes across the field than the low-yield group. Research conducted in Iowa, Minnesota and Wisconsin has shown that tillage has a minor affect on soybean yields and the United Soybean Board has credited conservation tillage production systems with decreasing soil erosion in the United States by 93 percent.
Most of the soybeans in Michigan are planted after corn and the quality and quantity of corn residue has increased in recent years. The higher residue levels has the potential to interfere with planting equipment performance, reduce soil drying and warming in the spring and reduce soybean germination and emergence. Due to financial and environmental implications, further research is needed to determine the economic returns to tilling the soil prior to planting soybeans and which tillage implements can provide both economic and conservation benefits.
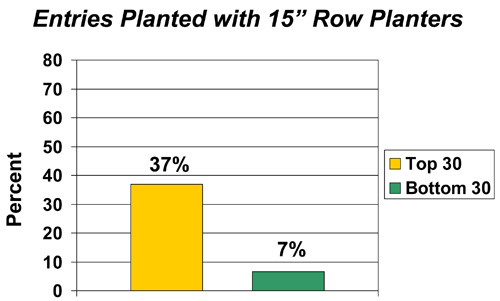
Planting equipment. The high-yield group also utilized 15-inch split-row planters to a greater extent than the low-yield group. The 15-inch row spacing produces the yield benefits of narrow rows and using planter units offers more precise and uniform seed depth, seed metering and seed-to-soil contact. Planter units also function better than grain drills under high residue conditions. A final benefit of planting soybeans with 15-inch split-row planters is that seed costs can be reduced by 15 percent.
Rotation. Crop rotation may have also contributed to higher yields as 77 percent of the high-yield group planted soybeans after corn and only 40 percent of the low-yield group planted after corn. Additionally, 7 percent of the high-yield group planted soybeans after soybeans whereas 20 percent of the low-yield group’s entries were planted after soybeans.
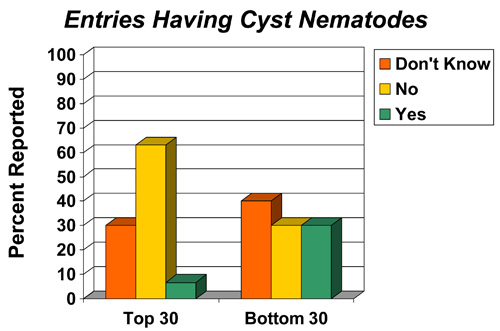
Soybean cyst nematodes. Soybean cyst nematode (SCN) pressure was a probable factor differentiating the two groups. Only 7 percent planted their entries in fields known to be infested with SCN and 30 percent of the low-yield group planted into SCN-infested fields. A higher percentage of the high-yield producers had sampled their fields for SCN. Soybean cyst nematodes are the most damaging soybean pest in the United States.
Soil pH. The average soil pH levels differed between the two groups. The average pH for the high-yield group was nearly an ideal 6.6 and the average for the low-yield group was on the high side at 6.8. The higher soil pH levels have the potential to reduce manganese availability. This is important as soybeans are highly responsive to manganese. Furthermore, researchers at Iowa State University found that high soil pH levels were correlated with higher SCN populations.
Similarities between high- and low-yield producers
Several management practices were implemented similarly by the two groups. The practices described below probably did not contribute to the difference in yields between the two groups.
Planting population. The average planting population for the high-yield group was 169,567 seeds per acre which was essentially the same as that of the low-yield group (170,600). Michigan State University recommends planting 175,000 seeds per acre in 7.5-inch rows, 150,000 seeds per acre when planting with 15-inch split-row planters and 130,000 seeds per acre in 30-inch rows. These planting rates assume that the warm germination test is 90 percent or greater.
Variety maturity. The average maturity rating for the high-yield group was 2.8 and the average for the low-yield group was 2.7. Recent research results from the University of Wisconsin showed that varieties within maturity group II maximized yield throughout most of the state. At latitudes between 42.7 and 43.3°N, yield was maximized by growing group 2.6 to 2.9 varieties. At latitudes between 43.7 and 44.1°N, group 2.1 to 2.4 varieties performed the best and group 2.0 to 2.2 varieties maximized yields when planted at latitudes between 44.5 and 44.9°N.
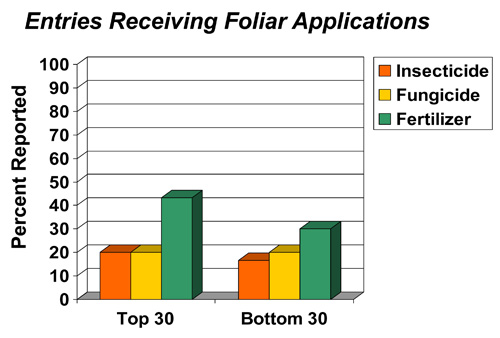
Foliar applications of insecticides, fungicides and fertilizers. Foliar applications of insecticides and fungicides were not widely used by either group. Only 20 percent of the high-yield group and the low-yield group applied foliar fungicides. Foliar insecticides were applied by 20 percent of the high-yield group and 16 percent of the low-yield group. The high-yield group did apply foliar fertilizers to a greater extent than the low-yield group. However, foliar fertilization did not consistently increase soybean yields in hundreds of unbiased research trials conducted in the United States.
If you would like to enter the Michigan Soybean Yield Contest in 2012, contact Ned Birkey at Spartan Agricultural Consulting, LLC at 734-260-3442. Ned created the yield contest in 2006 while working for MSU Extension and has coordinated it ever since.
This article was produced by the SMaRT project (Soybean Management and Research Technology). The SMaRT project was developed to help Michigan producers increase soybean yields and farm profitability. Funding for the SMaRT project is provided by MSU Extension and the Michigan Soybean Checkoff program.


 Print
Print Email
Email


