Look at this data!
Two Center for Systems Integration and Sustainability members tied for second place in a campus competition to translate data into a compelling visual.

Two CSIS members tied for second place in a campus competition to translate data into a compelling visual.
PhD students Veronica Frans and Yingji Li placed in the Social Science Data Analytics (SSDA) Data Visualization Challenge, which judges works on communication effectiveness, creativity and design.
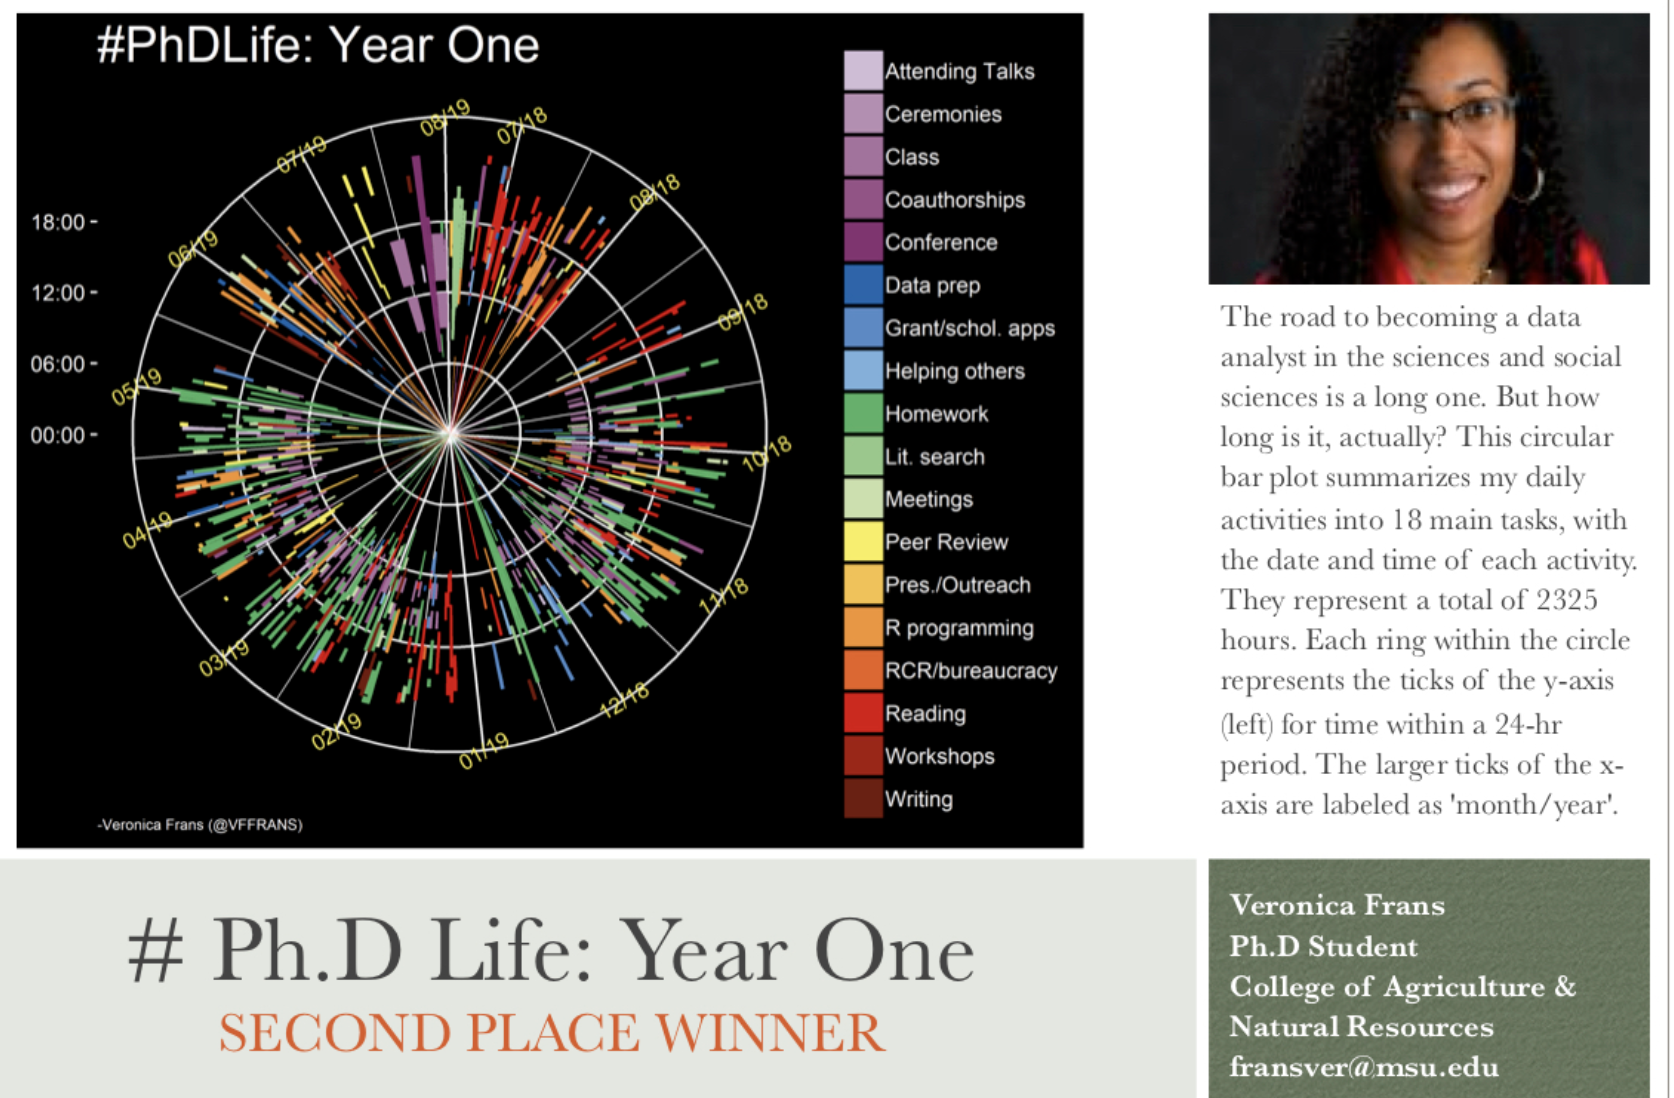
Frans visualized one year in the life of a PhD student.

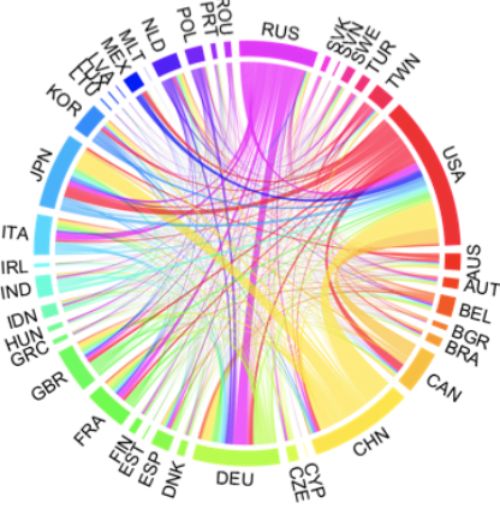
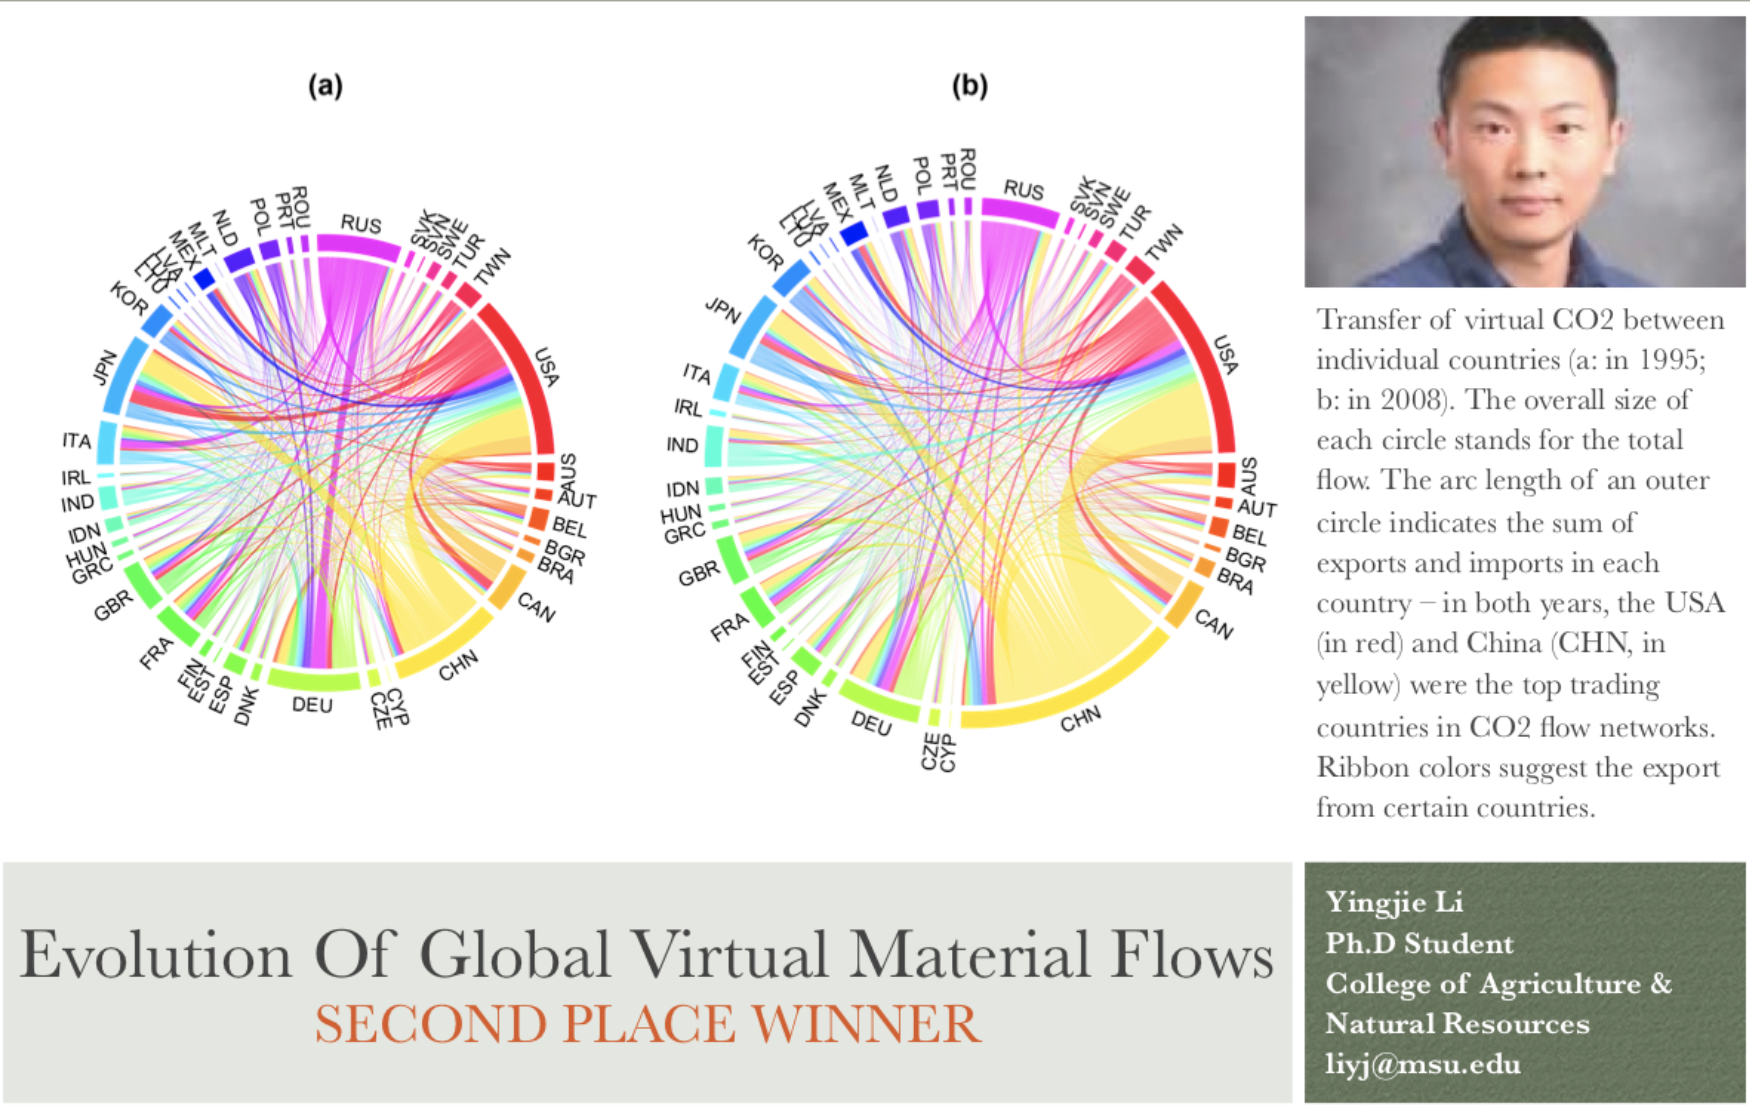
Li made art of the evolution of global virtual material flows.

First place went to Zachary Neal, an associate professor in social science, for "Waves of Polarization in the US Senate."
SSDA, part of MSU's College of Social Science, provides a platform to inspire innovations in social science research by promoting data analytics.


 Print
Print Email
Email
