Maximizing returns on seed corn investments – 2013 trial results
Investment in corn hybrid seed is, of course, an annual necessity. Which corn population returns the most for your investment?
Michigan State University Extension educators who work with the Thumb Ag Research and Education (TARE) project evaluated optimal corn seed populations in 2013. Planted populations ranged from 30,000 seeds per acre to 44,000 seeds per acre with incremental increases of 2,000 seeds. This population study was established at two sites in Huron County, one near Pigeon, Mich., and the other near Filion, Mich. This study was similar to a series of studies established in 2008-2010 when the evaluated populations ranged from 24,000 to 38,000 seeds per acre and where 32,000 seeds per acre were found to be the most profitable population.
The corn was planted in 30-inch rows and the hybrid Great Lakes 4879VT2RIB was used. Note that the studies were established on high yielding, well-tiled loamy ground. Actual plant stands were measured June 11, 2013. The Pigeon site was planted on May 14, and the Filion site was planted on May 15. Actual populations were very similar to planted populations. See the following table.
|
Pigeon |
Filion |
||||
|
Target pop |
Actual pop |
% of target |
Target pop |
Actual pop |
% of target |
|
30K |
30,750 |
102.5% |
30K |
30,250 |
100.8% |
|
32K |
31,813 |
99.4% |
32K |
32,250 |
100.8% |
|
34K |
33,625 |
98.9% |
34K |
33,750 |
99.3% |
|
36K |
35,688 |
99.1% |
36K |
36,000 |
100.0% |
|
38K |
37,250 |
98.0% |
38K |
38,250 |
100.7% |
|
40K |
38,500 |
96.3% |
40K |
39,250 |
98.1% |
|
42K |
42,813 |
101.9% |
42K |
42,750 |
101.8% |
|
44K |
43,667 |
99.2% |
44K |
43,375 |
98.6% |
Gross returns per acre for each population were calculated using a corn price of $4.30 per bushel and a per bag seed cost of $275. Thus, each incremental increase of 2,000 seeds increases costs $6.88 per acre and an additional 1.6 bushels per acre yield would be necessary to cover the increased seed cost. See the following tables for results.
Two site average yield by population
|
Target pop |
Actual pop |
Yield (Bu/A) |
|
30,000 |
30,250 |
190.4 |
|
32,000 |
32,250 |
196.1 |
|
34,000 |
33,750 |
198.2 |
|
36,000 |
36,000 |
198.8 |
|
38,000 |
38,250 |
202.7 |
|
40,000 |
39,250 |
204.4 |
|
42,000 |
42,750 |
200.1 |
|
44,000 |
43,375 |
205.1 |
The difference in yield was greater than 5 bushels per acre between the 30,250 and 32,250 plants per acre (30,000 and 32,000 seeds per acre) rates. The differences between all other populations were 5 bushels per acre or less.
The following tables show a regression analysis of the data from the two sites. Values of $4.30 per bushel for corn and $275 per 80,000 seeds were used for the regression analysis.


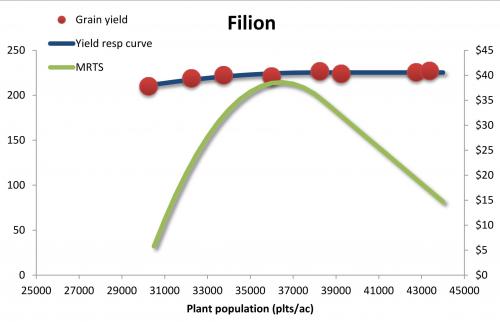
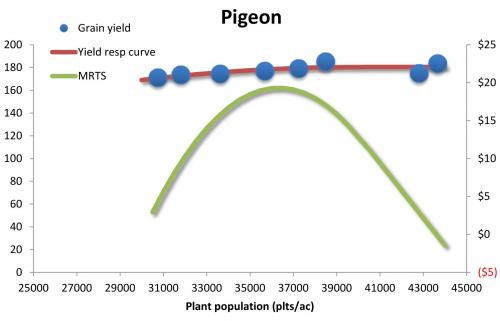
According to the regression analysis, yields maximized at 38,000 plants per acre at Filion and 40,000 plants per acre at Pigeon. Maximum dollars return to seed ($4.30 corn and $275 seed) was identical for each location at 36,500 plants per acre.
This study will be repeated in 2014 and 2015.
The author gratefully acknowledges the assistance of Bob Nielsen, Professor of Agronomy, Purdue University, for providing the regression analysis and for his assistance in interpreting these results.
The Corn Marketing Program of Michigan provided funding to make this study possible.


 Print
Print Email
Email