Mild winter: A summary analysis of the winter of 2023
An in-depth look at temperatures this winter and what it could mean for field crop production in 2023.
The 2022-2023 winter in many ways could be described as volatile or perhaps even abnormal in terms of temperatures. When someone mentions a mild winter, they are often referring to average temperatures being higher than normal measured against historical trends in a region. The term “mild winter” can be subjective to each person. However, there is data that we can analyze to determine how this winter compares with past winters. The goal of this weather analysis is for agricultural professionals to use this information to make informed decisions about this upcoming production year. Weather-related analysis is particularly useful for forecasting potential integrated pest management and pathogen challenges in crop production.
Michigan State University Extension has a weather analysis tool called MSU Enviroweather. Utilizing MSU Enviroweather, we can look at the summary of temperatures at various weather stations positioned throughout the Great Lakes region. For this example, we are using the Entrican weather station located in Montcalm County, Michigan. The graphs below show a comparison of temperatures between 2022 and 2023 during the time period of Jan. 1 – March 1.
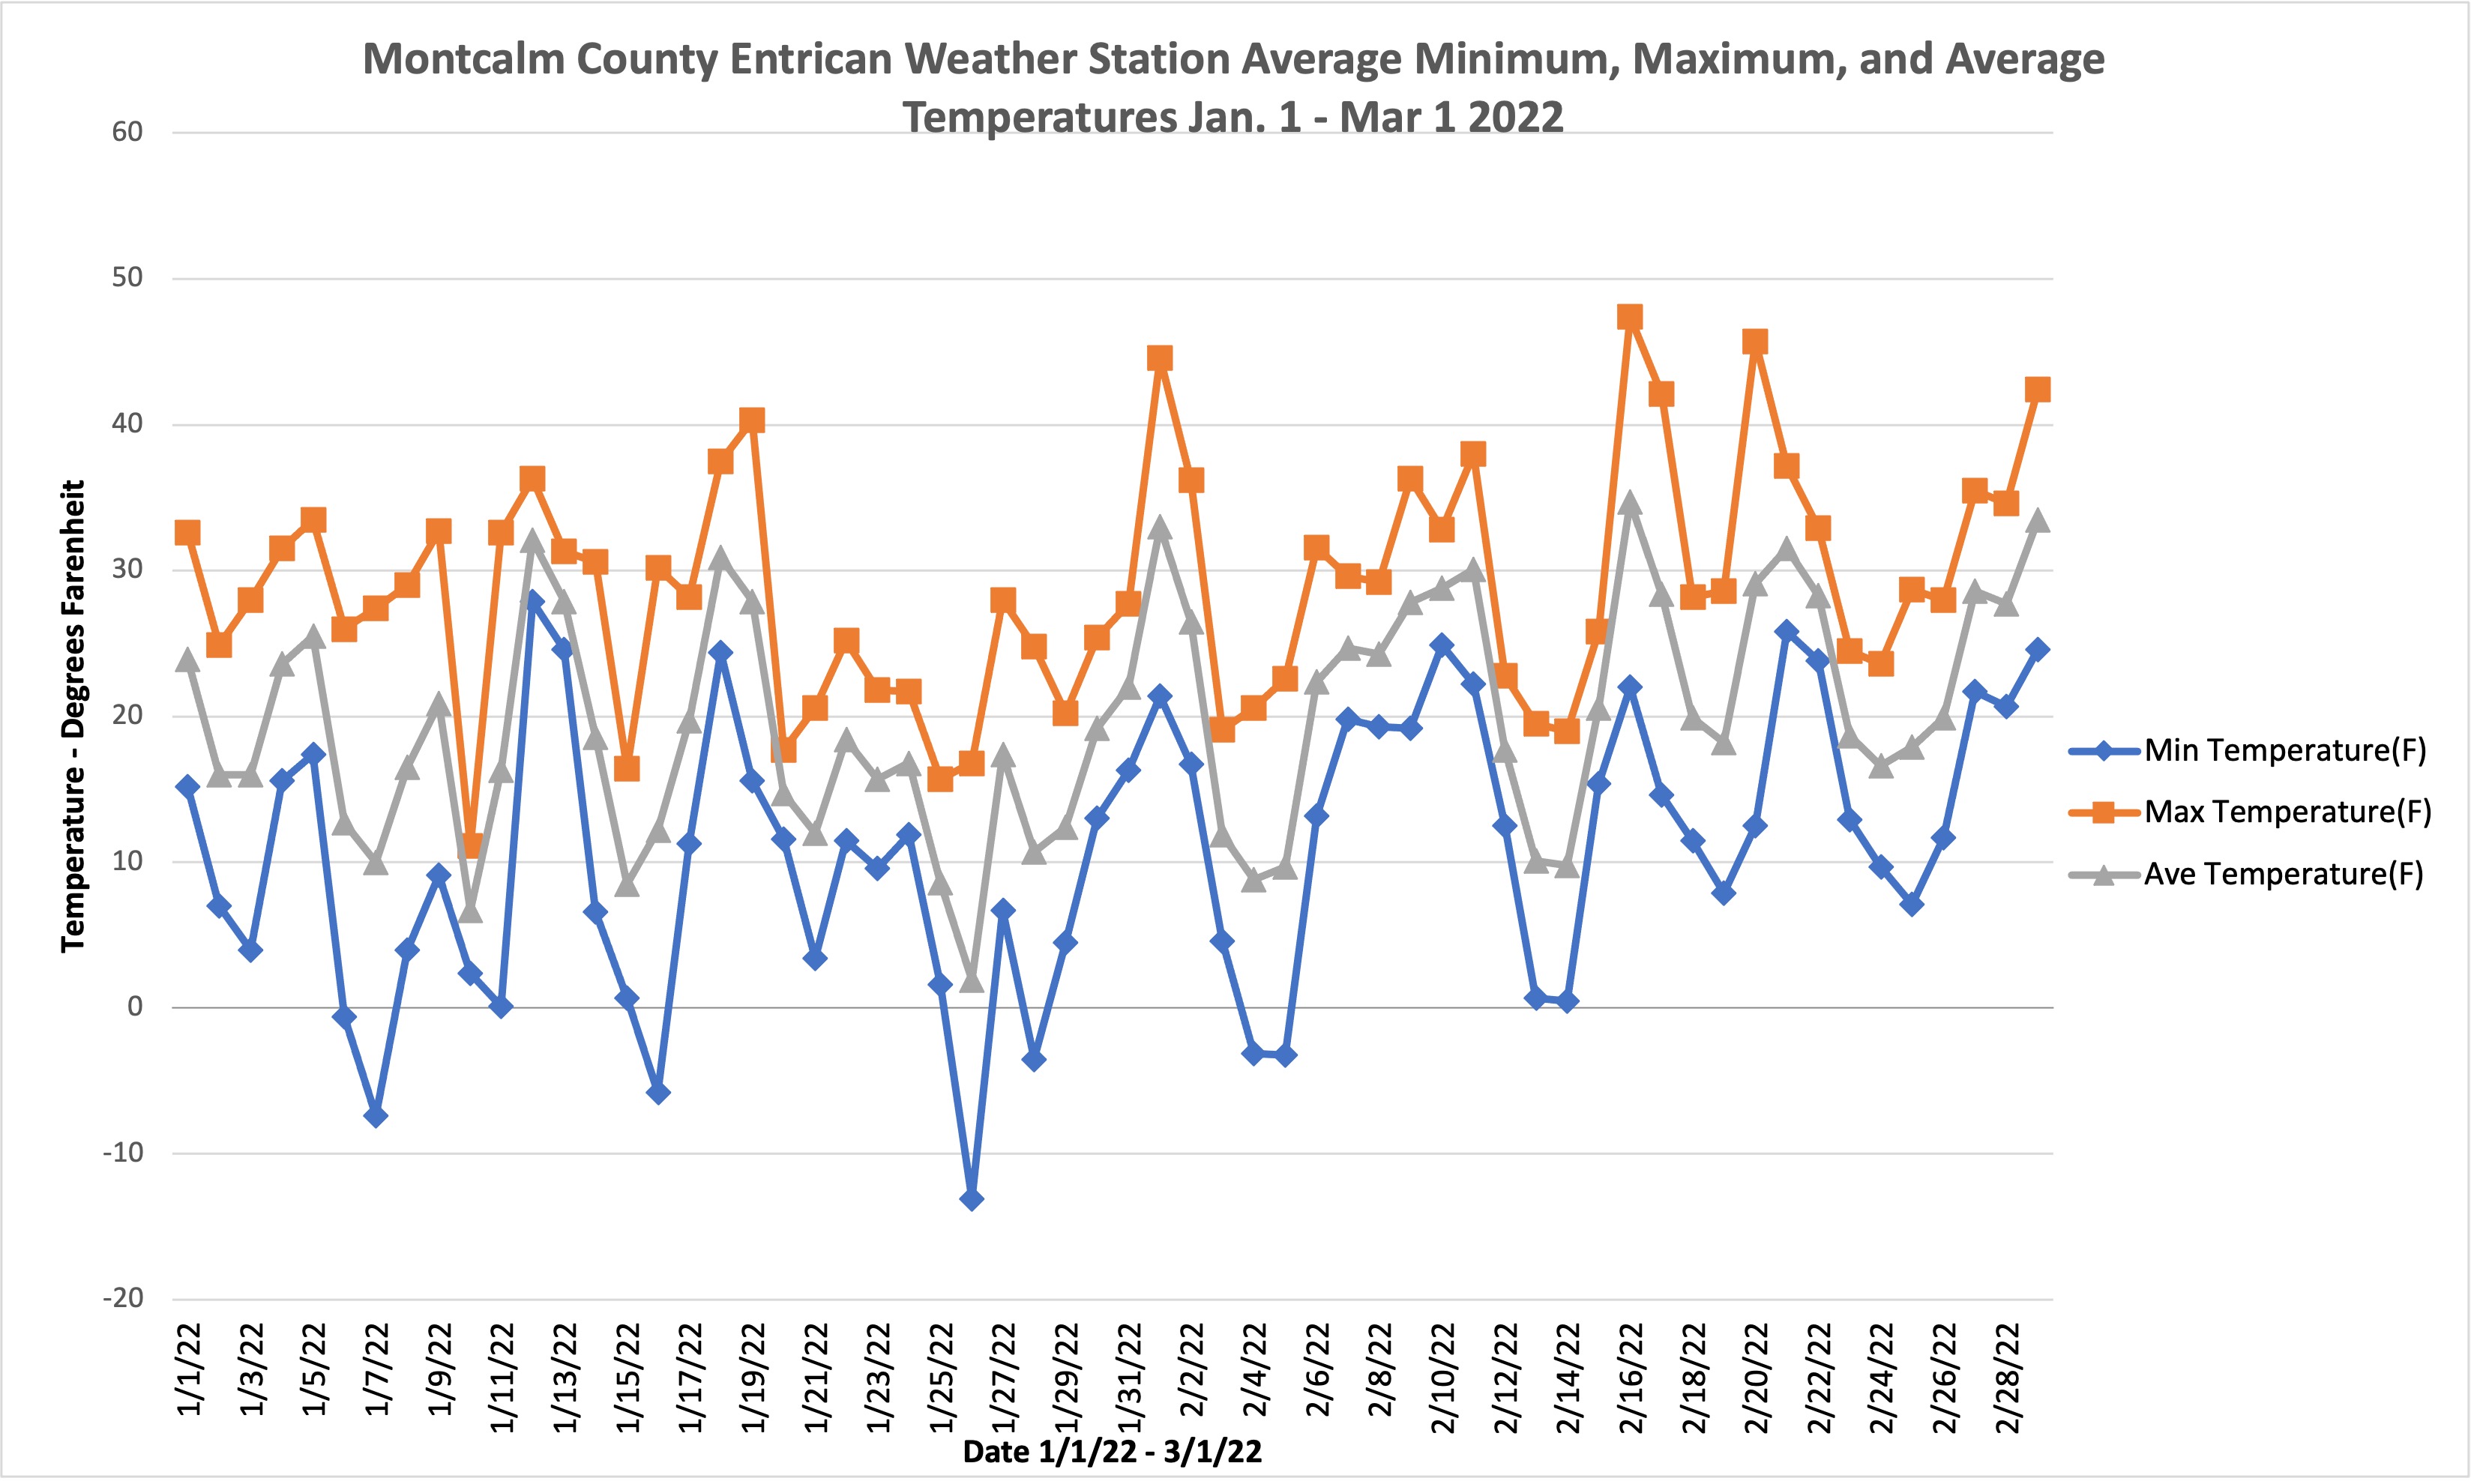
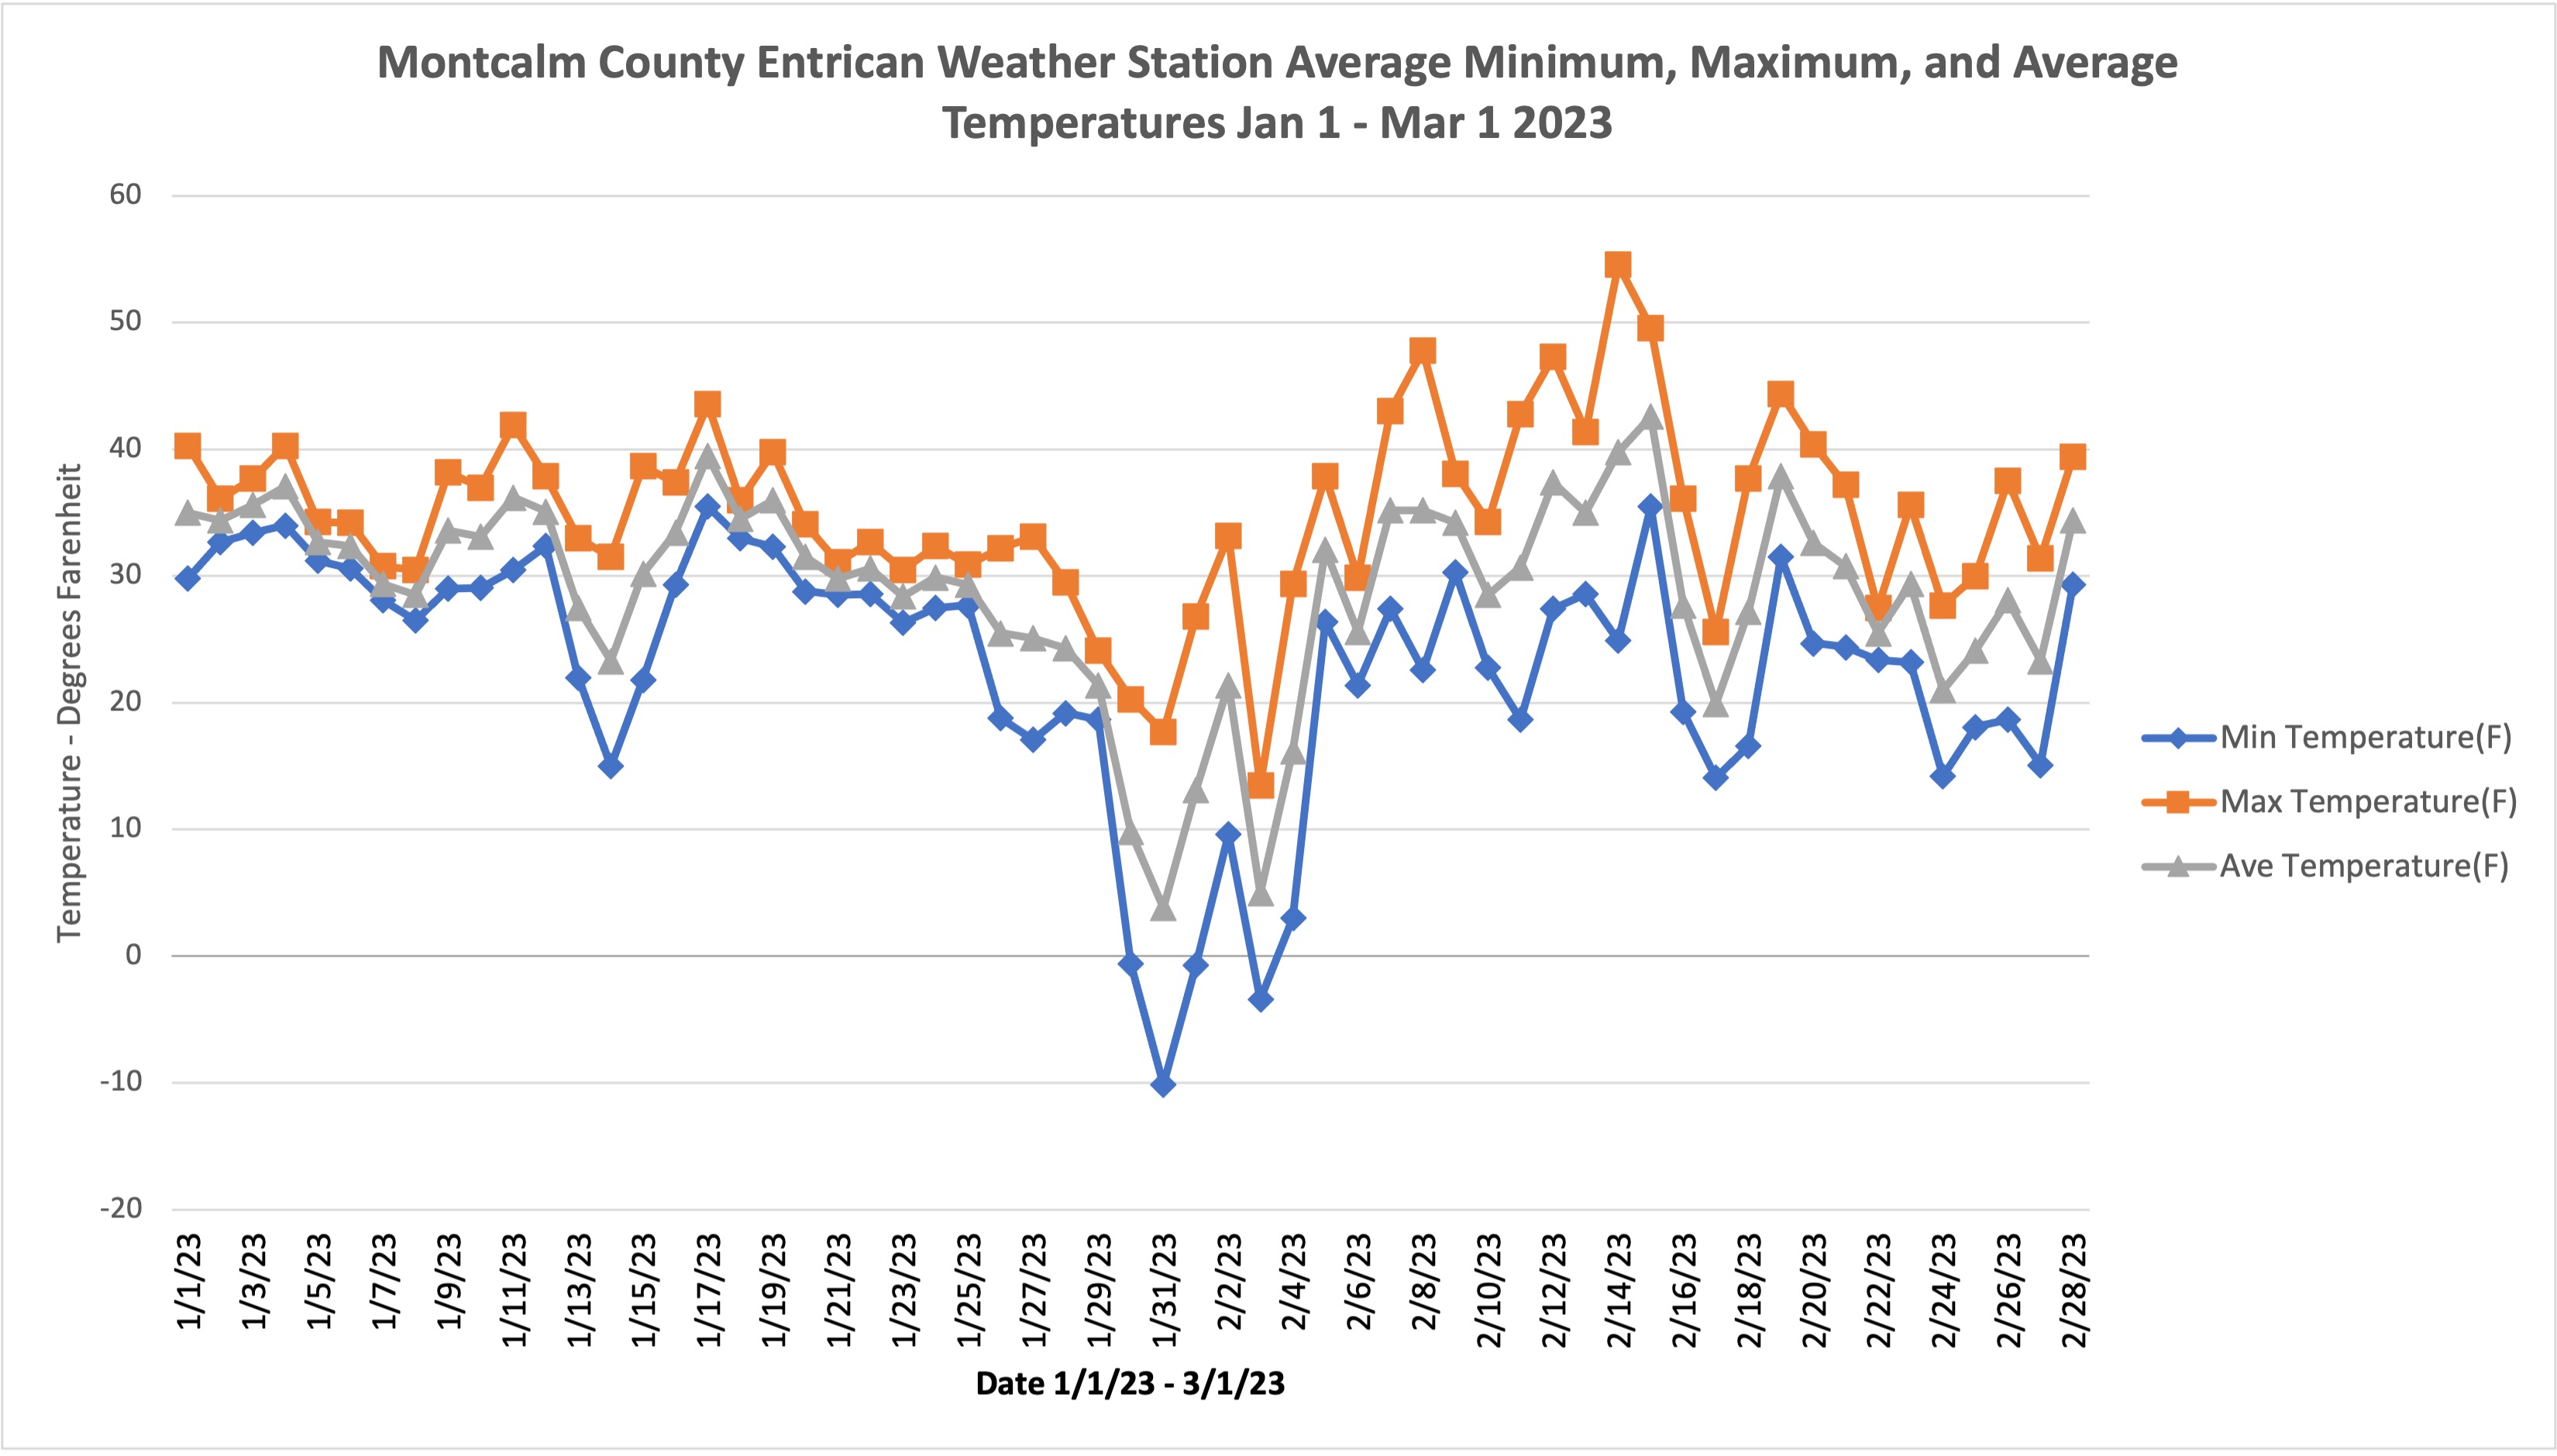
Winter 2023 thus far has a higher concentration and tighter spread of data points in the 30 to 40 degrees Fahrenheit range when compared with 2022, especially throughout January. Temperatures in 2023 were also more volatile with a sudden drop in low temperatures in late January.
The minimum temperature average, maximum temperature average, and average overall temperatures for this period are listed below for each year. The average minimum temperature of this period in 2023 is 12.3 F warmer than in 2022. The average maximum temperature is 6.4 F warmer than in 2022. Finally, the average temperature in 2023 during this period summary is 9.4 F higher compared to this period in 2022. This year, most cities in Michigan had anywhere between the third warmest and seventh warmest January on record.
|
2022-2023 Entrican Enviroweather Station minimum, maximum and temperature averages Jan. 1 – March 1 |
||
|
2022 |
||
|
Min. Temperature (F) |
Max. Temperature (F) |
Ave. Temperature (F) |
|
10.9 F |
28.8 F |
19.9 F |
|
2023 |
||
|
Min. Temperature (F) |
Max. Temperature (F) |
Ave. Temperature (F) |
|
23.2 F |
35.2 F |
29.3 F |
The year-over-year average temperatures were higher in 2023 compared to 2022. It is also helpful to compare the 2023 average temperatures with 30-year averages from 1991-2020 in the same period of Jan. 1 – March 1. The Greenville, Michigan, Enviroweather station was used for this example.
|
1991-2020 Greenville Enviroweather Station minimum, maximum and temperature averages Jan.1 – March 1 |
||
|
1991 – 2020 (Greenville) |
||
|
Min. Temperature (F) |
Max. Temperature (F) |
Ave. Temperature (F) |
|
15.9 F |
37 F |
26.4 F |
|
2023 (Entrican) |
||
|
Min. Temperature (F) |
Max. Temperature (F) |
Ave. Temperature (F) |
|
23.2 F |
35.2 F |
29.3 F |
The average temperature in 2023 is 2.9 F warmer than the 30-year average in this time period. Average maximum temperatures in the 30-year average were 1.8 F warmer than in the 2023 summary period. Average minimum temperatures in the 2023 summary period were 7.3 F warmer than the 30-year average.
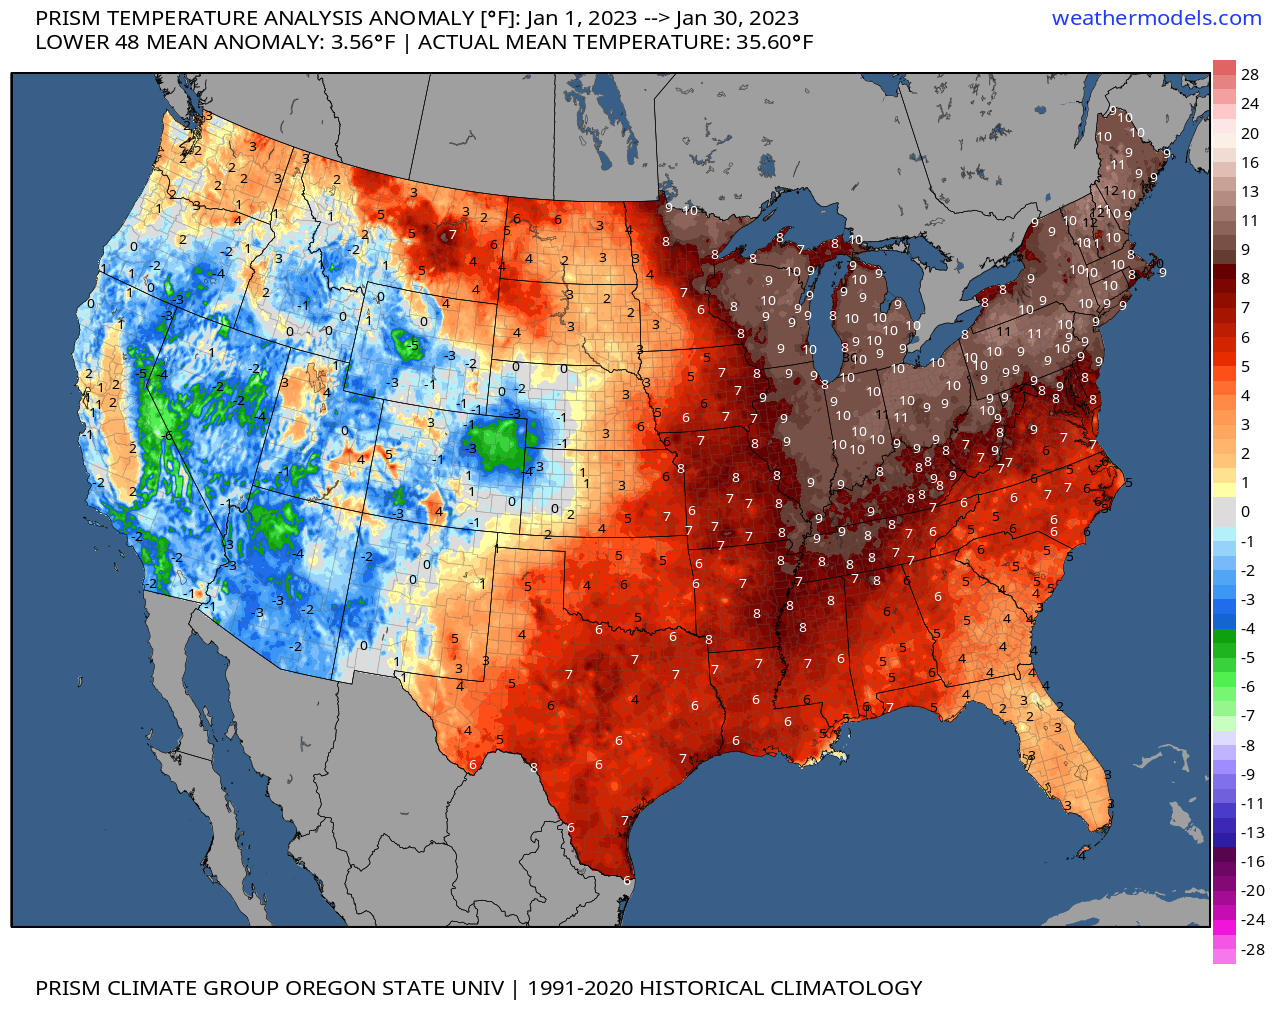
Finally, we have a map from NOAA National Centers for Environmental Information showing records to near-records this year for temperature and precipitation.
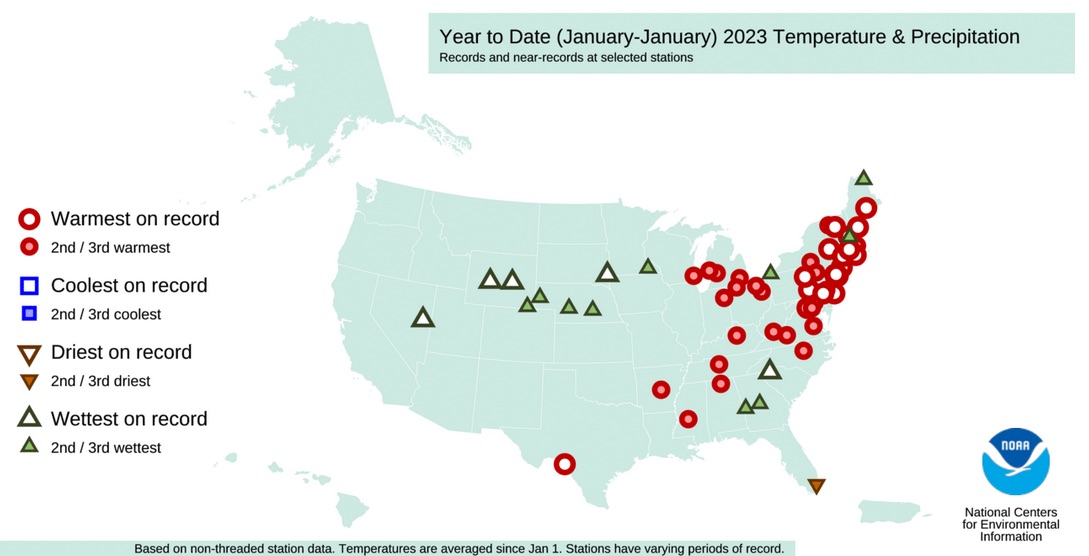
You can see a high concentration of red circles with orange fill in the Great Lakes region denoting the second and third warmest temperatures on record for the winter of 2023. It is important to note that the northeastern region of the United States has experienced some of the warmest temperatures on record.
The goal of this weather analysis is to help agribusiness professionals make informed decisions about the upcoming production season. In terms of integrated pest management, larger insect populations could be possible this year and could contribute to production challenges. Earlier green-up from mild temperatures in winter and spring are correlated with larger pest populations due to early insect emergence.
It is also possible we could see larger populations of some pathogens this year due to warmer winter temperatures. This is especially true if fields have a history of pathogens or are on a less-frequent crop rotation. These factors and correlations can change rapidly depending on weather and temperatures in the spring however. Therefore, monitoring pest and disease pressure and remaining observant this spring is an important component in the successful management of field crops.
Given the data and our analysis of temperatures this year, it is possible we could experience heavier pest and disease pressure in our 2023 production year. However, as most Michiganders know, spring in Michigan can be characterized as volatile. Historically, it is possible to experience everything from late spring snow and cold snaps to temperatures reminiscent of early summer. There is still plenty of time left this season for cold, wintery weather to impact Michigan before the upcoming growing season.
If you’d like to learn more about how mild winters can affect insect populations, see “How insects survive cold: The potential effect of a mild winter” from Michigan State University Extension.
Additional information about mild winters and pathogens can be found in a 2016 Ohio State University Extension Newsletter, “Mild winter, pathogen survival, and early disease development.”


 Print
Print Email
Email