Purpling in corn
Editor’s note: This article is from the archives of the MSU Crop Advisory Team Alerts. Check the label of any pesticide referenced to ensure your use is included.
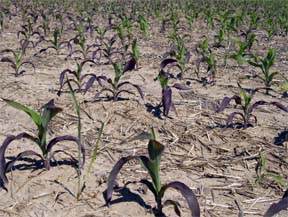
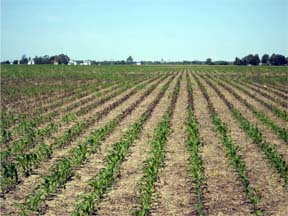
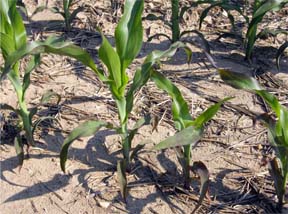
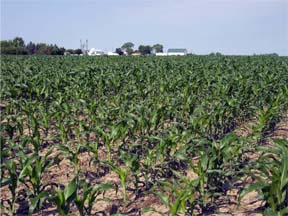
The cool, wet conditions we have experienced this spring have created ideal conditions for nutrient deficiencies to arise in corn fields. On June 12, corn at the V2-V3 stage in a field east of Reese on M-81 was found to be displaying severe purpling, most pronounced on the lower leaves. As seen in these photos, this purpling was variable though the field and not readily associated with any consistent pattern such as topography, tile lines or application equipment.
Whole plant tissue samples did not indicate any striking nutrient deficiencies. Nutrient sufficiency ranges listed are for whole plants less than 12 inches tall, and provide an idea of what constitutes a low value. Purpling in corn, such as seen here, is often associated with phosphorus deficiencies. Samples from the poor areas of the field are low in P, 0.22 percent compared to the critical sufficiency value of 0.30 percent.
Soil samples from both good areas and poor areas in the field, however, provide a clearer picture of agronomic conditions contributing to the corn’s state. Soil pH is dramatically lower in areas of poor corn growth, likely contributing to the observed deficiencies. Soil pH, among other things, decreases nutrient availability. Magnesium levels are also observed to be low, with low pH in the poor areas a likely contributing factor. Magnesium availability declines as soil pH falls below 5.6.
While areas of poor corn growth display classic P deficiency symptoms, the root cause of this issue is probably more attributable to low soil pH and resulting Mg uptake problems.
Revisiting this field on June 25, areas of poor growth in the field are still evident, but the nutrient deficiency symptoms have disappeared. Stunted plants can still be seen in pockets, and some of these plants still have residual purpling on the lower most leaves.
Whole corn plant (V2-V3) samples from areas of good and poor growth.
|
N |
P |
K |
Ca |
Mg |
S |
Mn |
Fe |
B |
Cu |
Zn |
|
|
% |
ppm |
||||||||||
|
Good |
4.47 |
0.34 |
3.47 |
0.66 |
0.28 |
0.25 |
55 |
483 |
13 |
8 |
39 |
|
Poor |
4.09 |
0.22 |
3.74 |
0.56 |
0.22 |
0.23 |
70 |
509 |
5 |
4 |
54 |
|
Sufficiency Range |
3.50-5.00 |
0.30-0.50 |
2.50-4.00 |
0.30-0.70 |
0.15-0.45 |
0.15-0.50 |
20-150 |
21-250 |
4-25 |
6-20 |
20-7 |
Nutrient sufficiency ranges for corn less than 12 inches: Plant Analysis Handbook II, p191, H.A. Mills and J. B. Jones, Jr., MicroMacro Publiching, Inc., Athens, GA.
Soil test levels from areas of good and poor growth
|
OM |
pH |
CEC |
Bray P1 |
K |
Ca |
Mg |
S |
Mn |
Fe |
B |
Cu |
Zn |
|
|
% |
meq/100 g |
ppm |
|||||||||||
|
Good |
1.7 |
7.1 |
8.0 |
33 |
109 |
1200 |
210 |
8 |
36 |
19 |
0.5 |
0.9 |
4.3 |
|
Poor |
1.3 |
5.4 |
5.9 |
65 |
119 |
500 |
80 |
9 |
32 |
33 |
0.2 |
0.8 |
4.4 |


 Print
Print Email
Email


