Southwest Michigan field crops update – April 7, 2022
Continued rain will keep most farmers out of fields for the first half of April if current forecasts hold.
Weather
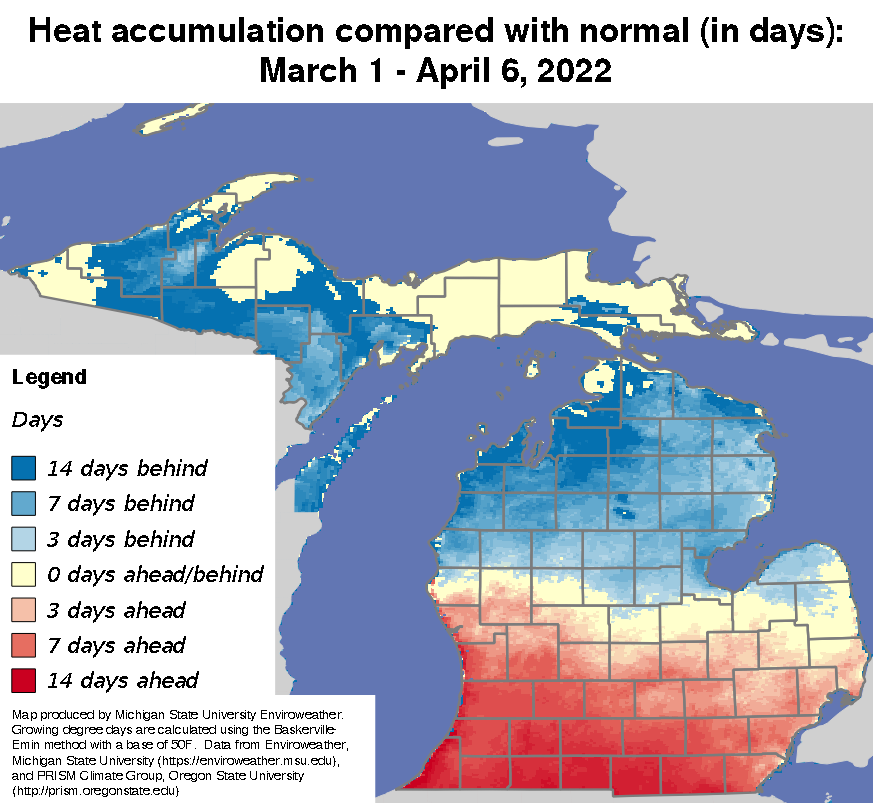
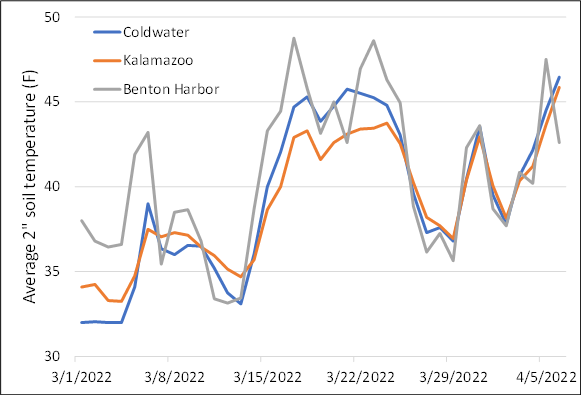
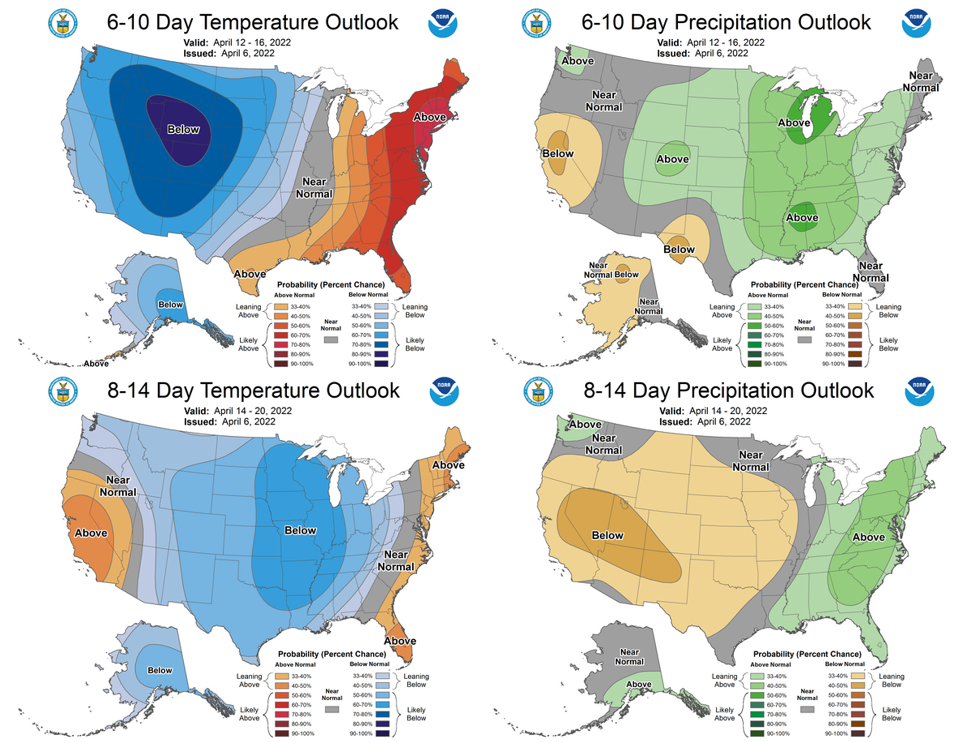
Temperatures this past week were 2-4 degrees Fahrenheit cooler than normal for southern Michigan. However, due to warm temperatures in March, we are at least two weeks ahead of normal in the accumulation of growing degree days (GDD) base 50 F. Soil temperatures continue to increase with average temperatures at 2-inch depth near 45 F. We will be on a bit of a roller coaster for the next two weeks as temperatures will drop over the next few days with highs only in the 30s or 40s, then rise into the 60s and 70s early next week with the passage of a weather system out of the southwest, then drop again during the third week of April as a troughing feature gradually moves east across the Upper Midwest. Current models suggest a return to warmer-than-normal temperatures for the end of the month.
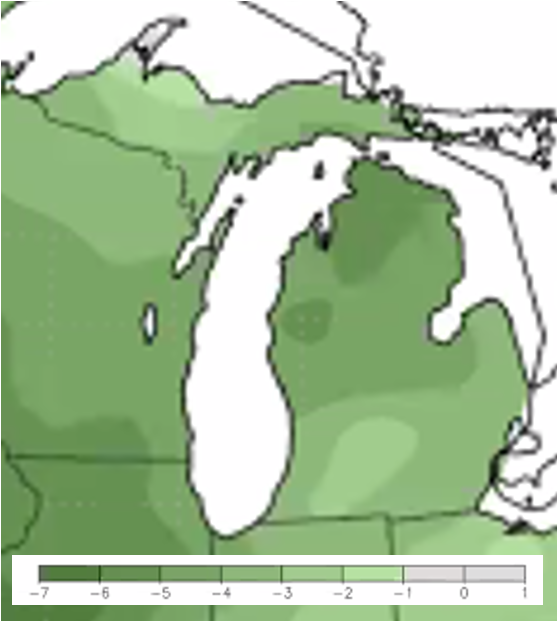
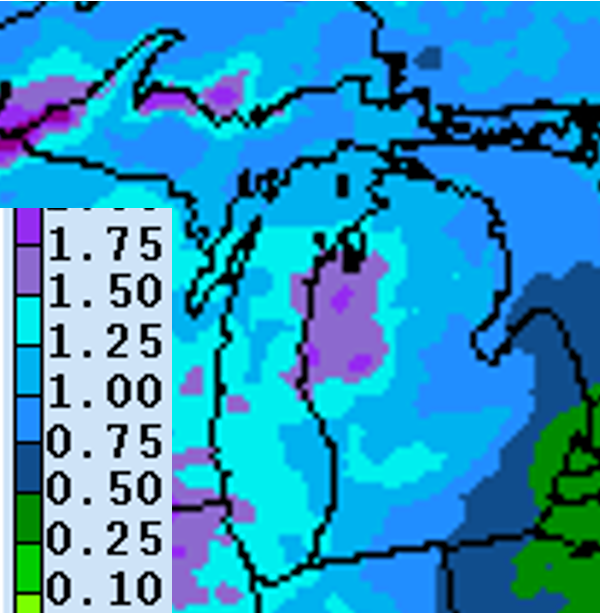
Precipitation has been the main story this past week with accumulations of 0.5 to nearly 2 inches with a distinct northwest-to-southeast gradient in the region. Rainfall has been above normal over the past two weeks for most of the region with over two times the average rainfall toward the northwest. The forecast for the coming week unfortunately will not afford many, if any, opportunities for field work with an additional 0.75-1.50 inches expected.
A low pressure system currently over northern Wisconsin that brought precipitation on Wednesday is slow moving and will linger as it heads east, bringing a small amount of additional rain and possible snow Thursday into early Saturday. A change in upper air flow starting late this weekend into the middle of next week will bring warmer temperatures from the southwest and daily rainfall for at least the first half of the coming week. We can expect wetter than normal conditions until at least the third week of April.

Wheat
Green up nitrogen (N) applications of 50-60 pounds actual N per acre should go on wheat that did not achieve two to three tillers last fall—assuming fields dry up enough to become trafficable—with the remainder applied prior to jointing. If tillering did occur last fall, wait and apply a single N application at Feekes 5-6 (prior to jointing). For more information about early-spring wheat management, read the recent Michigan State University Extension article, “Evaluating wheat stands and spring management.”
In this this week’s MSU Extension Field Crops Virtual Breakfast, field crop soil fertility specialist Kurt Steinke showed results from a study he conducted looking at which fertilizer inputs increased yield in wheat planted at two different timings. The main takeaway was that several fertilizers improved yield significantly above no fertilizer application. However, the greatest yield increases occurred with the early planting date compared with the late (mid-October) planting date.
|
Results of research aimed at identifying beneficial inputs made to winter wheat at early and late planting timings. Table courtesy of Kurt Steinke. | ||
|---|---|---|
|
Treatment |
Early plant |
Late plant |
|
Grain yield (bu/A-1) | ||
|
Plant and nothing |
39.2 e |
42.6 e |
|
25 N Autumn |
89.2 ab |
74.3 d |
|
65 P2O5, 15 N |
89.1 ab |
69.2 d |
|
25 S |
82.8 bc |
69.2 d |
|
50 K2O |
75.0 cd |
71.5 d |
|
30 N, 100 P, 25 S, 2.5 Zn |
95.9 a |
72.2 d |
|
Spring N only |
87.9 b |
67.6 d |
|
87 K, 25 S |
88.6 ab |
73.7 d |
|
P > F (< 0.01) |
LSD (0.05) = 7.8 |
|
Insects
It is that time of year again to start scouting for overwintering insects, grubs and slugs and to begin trapping for moths that ride spring storms up from the southern U.S. I have put out bucket traps in St. Joseph and Kalamazoo counties for true armyworm and black cutworm and will be reporting weekly trap counts to track when peak flight occurs for these species. I will also be reporting trap counts from Purdue University Extension as they serve as our early warning system.
Weeds
For those who have fields that are trafficable, burndown herbicide applications for cover crops, winter annual or early summer annual weeds should be made when air temperatures are at least 40 F (including nighttime) for at least one to two days before and after the application. For those applying herbicides with an ACCase inhibitor (also known as post-grass herbicides including Select Max, Poast, Assure II, Fusilade, etc.), temperatures should be above 50 F. Although temperatures next week will be warm enough to spray, it is unlikely that fields will be dry enough and rains will hold off long enough to do so.
Early-season soil fertility
Early-season soil fertility was the topic of this week’s MSU Extension Field Crops Virtual Breakfast with soil fertility specialist Kurt Steinke. One of the most frequently asked questions that he gets in years like this with high fertilizer prices is can applications be withheld this year and how long does it take to draw down nutrient reserves in the soil. If your soil test report for phosphorus (P) or potassium (K) are within the maintenance range, Steinke says you can consider not applying this year to save on input costs and “make a withdrawal” from your “soil bank.” He presented data on average nutrient drawdown rates (actual rates will depend on soil type, buffer capacity, etc.) of 3 ppm decrease in soil test levels for both P and K for 180-bushel corn. For soybean, the average rates are 6 ppm decrease in soil test K and 3 ppm in soil test P for a 60-bushel crop.
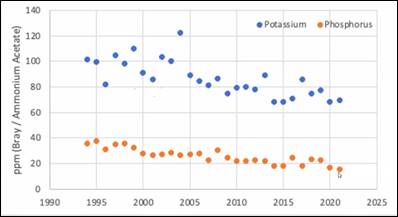
To show how long it takes for P and K test levels to decrease over time, Steinke showed data from a field at MSU’s Kellogg Biological Station that has not received P or K fertilizer since 1994. The caveat to that is the yields were relatively low in those plots so nutrient removal would have been greater with higher yields. He also said that about two-thirds of soil tests in Michigan are high or very high for soil test P, so it is likely that many farmers can reduce or withhold P fertilizer for at least this year—be sure to check your current soil test report.
Steinke has updated the maximum return to nitrogen (MRTN) model to include 2021 corn yields. The MRTN recommendation is a general pre-season N model that includes corn N response data from seven states, including Michigan, that allows growers to input current prices for corn and N fertilizers. The Corn Nitrogen Rate Calculator and the MSU Fertilizer Recommendation Program can be accessed from the Michigan State University Soil Fertility Research website. Steinke cautioned growers not to base their N applications on 2021 yields—or any record-setting yields—but rather to use yields that better reflect the expectation for a given field based on long-term averages.
If you were not able to join the session, the recordings will be closed-captioned and available at the Field Crops Virtual Breakfast webpage and the MSU Extension Field Crops Team social media platforms: Facebook, Spotify, YouTube, Apple Podcasts and Twitter.


 Print
Print Email
Email