The path to increased profit part 1: four key principles
 Print
Print Email
EmailDairy producers need to be constantly striving to increase farm profitability.
Profitable dairy production is always a challenge. Data from the Michigan Dairy Farm Business Analysis Summary shows from 1995 through 2010 gross cash margin on Michigan dairy farms averaged $0.82/cwt (Figure 1). However, the range was from -$2.26/cwt (2009) to $2.22/cwt (1999). The data also show gross cash margins were below $0.30/cwt in six of the 16 years (2000, 2002, 2003, 2006, 2009 and 2010). Every good businessperson knows profit is a function of both revenues and expenses. Therefore, good managers focus their efforts on the factors that influence both sides of the profit equation.
So, how can your dairy operation find the path to increased profitability? First, there is no one magic bullet. Second, hopefully during profitable times you will exercise the discipline to pay down some debt and salt some profit into savings. In this article we will discuss four over-arching principles dairy producers should always keep in mind to increase profitability. Then in our second article we will address specific management strategies to help you increase your farm’s profitability.
Principle #1: Know Where You Stand; Know Where You Are Going
Before making changes on your operation it is critical to know where you stand and develop a plan for where you are going. Therefore, perform a complete financial analysis of your farm operation. Routine financial analysis is something good managers should be doing all the time, but it is especially important when margins tighten. A complete financial analysis will allow you to calculate your cost of production and benchmark your farm’s financial performance so you know how you compare to industry standards. Without this analysis it is nearly impossible to identify where your greatest opportunities lay to increase revenue or cut costs. For example, Michigan Dairy Farm Business Analysis Summary data in Figure 2 show the ten largest cash expenses on Michigan dairy farms in 2010. How does your farm compare? Also, Figure 2 provides a guide as to where the emphasis should be on cutting costs. For example, a 10% cut in purchased feed costs would save over $0.527/cwt while a 10% cut in fuel and oil costs would only save $0.080/cwt. This analysis will allow you to challenge every enterprise and every expense on the farm.
Knowing your farm’s past performance also provides key information to formulate budgets for the future. At a minimum you should formulate a cash flow budget for each quarter. You also might want to consider several cost saving measures and/or technology changes (e.g., change rations, install sand bedding, switch from 2X to 3X milking). By having data specific to your farm you are in a much better position to accurately calculate “what if” scenarios evaluating these potential changes. This is an essential step in determining their feasibility.
Principle #2: Marginal Costs Versus Marginal Returns
Be extremely careful when cutting costs, because minimizing production costs may not necessarily result in higher profits. Instead, the key is to make each decision based on its marginal effect. In other words, you may cut costs by $1.00/cwt, but it doesn’t make sense if those cuts cause you to lose $1.10/cwt in milk revenue. So be careful, don’t cut costs merely for the sake of cutting costs! Make sure you don’t lose more revenue than you gain in cost savings.
Principle #3: Don’t Take New Investment Off the Table
In times of economic stress, most producers batten down the hatches and don’t consider the possibility of new farm investments. That is a poor strategy, so don’t overlook the possibility that added investment may help you become more profitable even though current profits are slim or nonexistent. Keep all new investments from new feed additives to improved facilities on the table. If the return from the new investment exceeds the additional cost then give serious consideration to making the plunge. However, make sure your analysis considers the timing of increased profit from the new investment. Such an analysis may indicate the investment is very profitable, but the positive marginal return is not immediate. In such cases delay the investment until better economic times return.
Principle #4: Cutting Feed Costs Has Consequences
As the old saying goes, “Don’t be pennywise and pound foolish.” Thus, don’t automatically assume cutting feed costs will lead to more profitable rations. Remember that numbers and a “balanced” ration are not the final arbiter. You must monitor actual feed intake and actual animal performance (milk volume, milk solids, dry matter intake, body condition, health, reproduction, etc.) before and after diet changes to insure any cost savings are not negated by lost milk and/or solids production or other unanticipated effects. Since this is the case, avoid changing several ration factors all at once, otherwise it will be impossible to determine whether a single ingredient’s subtraction or addition was helping or hurting.
When considering alternative feeds be sure to compare “apples to apples” by comparing competing feeds on cost per pound of dry matter, cost per Mcal of net energy for lactation, and by taking account of differences in protein (e.g., by comparing on a “corn-soy value” basis). Here are some important questions to ask when considering alternative feeds:
- How much of the feed must a cow eat to obtain equal energy and protein?
- How much effective fiber is in the feed?
- What is the energy source in the feed (e.g. starch, sugar, fiber, fat, protein)?
- How much of the feed’s protein is degraded in the rumen? How much is bypass?
- What is the feed’s mineral and vitamin content?
- Does the feed have any attributes that limit the amount fed?
- Will the feed alter dry matter intake?
I have programmed an Excel spreadsheet model that allows producers to logically determine if a ration change is profitable. To obtain a copy go the Michigan Dairy Review website and download the free Dairy Feed Change Evaluator. Next month we will consider some specific strategies in three major dairy management areas that may help you find more profit on your dairy operation.
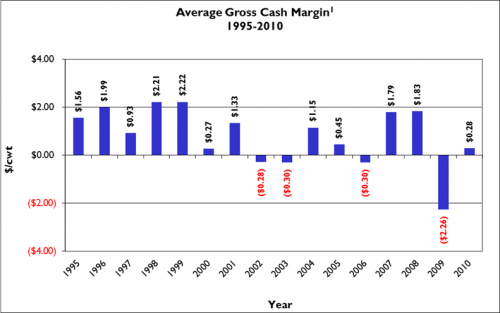
Figure 1: Gross cash margin, 1995-2010 (from Michigan Dairy Farm Business Analysis Summary).
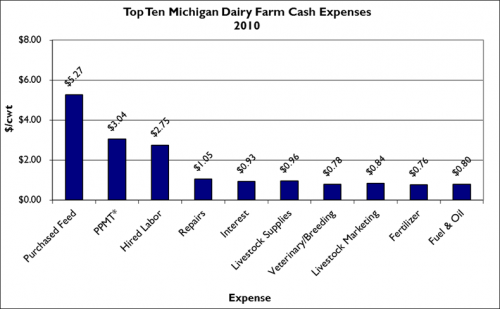
Figure 2: Top ten cash expenses per hundredweight for 2010 (from Michigan Dairy Farm Business Analysis Summary) (*PPMT equals principal payments).
This article is a part of a series of articles on increasing profits. To view the next article, part two specific strategies, visit the Michigan State University Extension news website.