Understanding the drought through the Evaporative Stress Index
A look at the Evaporative Stress Index explains patterns of water availability and moisture stress across large areas.
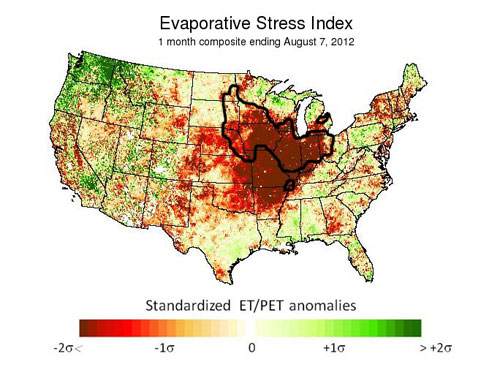
In the previous article What is evapotranspiration and why it matters, we discussed the role and importance of evapotranspiration in crop production systems and the impacts on water use this year because of the drought conditions. To better understand patterns of water availability and moisture stress over large areas, the USDA ARS’s Hydrology and Remote Sensing Lab has recently developed a new Evaporative Stress Index which depicts cumulative evaporative stress across the continental United States. See Figure 1 for an image of cumulative evaporative stress during the past 30 days.

Figure 1. Evaporative stress index averaged over the period July 8
through August 7, 2012. Brown-colored areas signify higher levels of
water stress while green denotes areas of relatively low water stress.
Major corn-producing areas (as defined by USDA NASS) are
outlined in a thick, black line. Figure courtesy of the USDA ARS
Hydrology and Remote Sensing Lab.
The index is based on the ratio of actual to potential evapotranspiration rates. If water available to plants on a given day is limited, the actual rate quickly falls below the potential rate and the ratio for the day is relatively low. If water is freely available, the actual rate approaches or is close to the potential rate and the ratio is high.
The index expresses this cumulative ratio in a standardized form, relative to a 10-plus year historical data record. Thus, in the figure for the period July 8 through August 7, 2012, brown-colored areas (low negative σ values) signify relatively higher levels of water stress while green denotes areas of relatively low water stress.
The pattern of serious water stress across the central United States as a result of the drought and relatively moist conditions across the Pacific Northwest is striking. Interestingly, in Michigan, the major differences between relative abundance of moisture across northern areas and shortages in the south are also visible.
For reference, we have outlined major corn-producing areas of the country (as defined by USDA NASS) in thick, black lines. The standardized form of the index also allows some information about how often this level of stress would be expected to occur, which in this case suggests less than 5 percent of the time across much of the central Corn Belt.
In terms of the growing season for corn, these unusually high levels of moisture stress generally occurred from late vegetative to pollination to early grainfill crop development stages. From the strong spatial correlation of high stress levels with major production areas, it is easy to understand why grain prices have skyrocketed during the past several weeks.
Additional information:
- MSU Extension’s Drought Resources
Dr. Andresen's work is funded in part by MSU's AgBioResearch.


 Print
Print Email
Email