What is evapotranspiration and why it matters
Under drought conditions, plants may not be able to extract water fast enough to keep up with evapotranspiration.
Among the many problems associated with extended periods of drought is the inability of plants to extract water at a rate fast enough to keep up with the rates of evapotranspiration (the combined loss of water from plant transpiration and soil evapotranspiration) that atmospheric conditions will allow. The rate of potential evapotranspiration (PET), the amount of water that could potentially be lost to evaporation over a vegetated surface given meteorological conditions at the time, is dependent on the intensity of solar radiation, air temperature, humidity and wind speed. Of these meteorological factors, solar radiation and air temperatures are most important here in Michigan, with somewhat less influence from humidity and wind speed.
Three of the factors (solar radiation intensity, air temperature and wind speed) are positively correlated with PET (i.e., the greater the intensity of solar radiation, the greater the PET), while humidity is negatively correlated (i.e., the greater the amount of water vapor already in the atmosphere, the less that can evaporate). PET also depends on the amount of crop type and its leaf area, the phenological stage and the amount of plant-available soil moisture in the rooting zone.
As should be apparent, there are an almost infinite number of combinations of these factors, which complicates the estimation of PET rates for a given crop of interest. For simplicity and by international convention, PET rates are typically estimated for a specific set of circumstances including a 4-inch high, unshaded, grass-covered surface with no soil water limitations. This special case is generally referred to as reference potential evapotranspiration (sometimes seen labeled as ET0), which can be related statistically to a specific crop type and growth stage of interest (i.e., an 8-foot high corn crop during early grain fill stage) to provide an ideal estimate of crop water needs.
ET0 is a primary input variable for most irrigation scheduling systems. The Enviro-weather information system provides ET0 on a daily basis for a weather station site and time period of interest. Once at the site, select a station of interest then choose "More weather" up at the top, located in the horizontal green bar. Scroll down the page to the "Water-use tools" section. The ET0 values are available under "Potential Evapotranspiration" application. Further information to help adjust the daily ET0 values into water need estimates for a specific crop and growth stage can be found in the "Water-use tools" section under "Irrigation Scheduling" and "Irrigation Scheduling Checkbook" menu options. See examples of PET given for many crops at different growth stages and how this concept is used in irrigation scheduling.
The other critical factor in this discussion is the amount of water actually lost by the vegetated surface, referred to as actual evapotranspiration or ET. Actual rates of evapotranspiration only reach potential rates when water is not limiting (i.e., after a series of heavy rain events, soil at or above field capacity). However, when the amount of plant-available water in the soil decreases, the actual rate of ET quickly falls to a fraction of PET. After long stretches of dry weather, the ratio of actual to potential evapotranspiration rates commonly falls to values below 0.50, and the accumulated frequency of this ratio over the course of a growing season is strongly correlated with yields of many (dry land) types of crop.
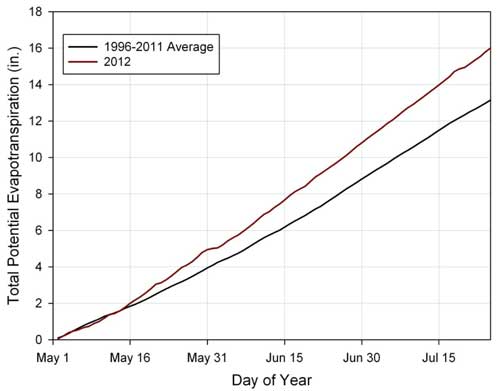
During the 2012 drought, rates of PET have exceeded both actual evapotranspiration rates and normal PET rates. Accumulated PET during the 2012 growing season versus the long-term average is depicted in Figure 1 for East Lansing, Mich., which is generally representative of conditions across the southern half of Lower Michigan. As can be seen in the figure, rates of PET have been abnormally high ever since the middle of May (the first half of that month was wetter and cloudier than normal), with a difference of 2.85 inches (21.6 percent above normal) by July 24. The difference during this period is due to several meteorological differences, including greater than normal solar radiation levels (8.5 percent greater than normal), higher air temperatures (3.1 degrees Fahrenheit higher than normal) and lower humidity (10.6 percent lower than normal).

Figure 1. Observed potential evapotranspiration (PET) from May 1 to
July 24, 2012 (red line), versus the long-term average (1996-2011, black line)
at East Lansing, Mich. Data courtesy MSU Enviro-weather.
Overall, in terms of crop water needs, this has resulted in a “double whammy” this growing season. Not only have soils generally not been able to supply sufficient water to meet crop needs due to the extended dryness, but rates of PET based on atmospheric conditions have been significantly greater than normal this year, which has exacerbated the effects of the drought.
Additional information:
- MSU Extension’s Drought Resources


 Print
Print Email
Email

