Will an improved ARC-CO program pay more often?
 Print
Print Email
EmailARC-CO will eventually consider extreme market conditions, but support may not arrive until several years later.

Recent legislation under the One Big Beautiful Bill (OBBB) has included updates to several Farm Bill Commodity Programs. In particular, the Agricultural Risk Coverage program had several changes made to improve support benefits. ARC-CO, which provides protection based on county losses, has historically struggled to trigger payments for corn and soybean growers. That begs the question, do the ARC-CO updates mean producers will see actual payments more often?
Historically, corn and soybean producers have not received a lot of support from the ARC-CO program. The lack of support was notable during the 2018 Farm Bill period or 2019-2024 production seasons. In particular, from 2022 through 2024, the corn price dropped $2.00 per bushel, and soybeans dropped over $4.00 per bushel. The loss of value has significantly impacted short and long-term financial stability for many farms. During this period, ARC-CO offered limited support to producers in most counties. The fundamental lack of support led to calls for program reforms, many of which focused on the need for aid during these types of market conditions.
How does ARC-CO work?
ARC-CO payments are based on revenue, which makes both price and yield important factors. Prices are based on a market year average price (MYA). Yields are based on county-reported values versus individual farm yields. How USDA tracks yield data for counties is important. Some counties may track non-irrigated versus irrigated yields, which means payments can be calculated for both types of acres. Other counties may simply track “all” yields together and base payments on all county yields reported for a crop.
Payments for ARC-CO are calculated by comparing the actual county revenue against the guaranteed revenue for the same county. If the actual revenue is less than the guaranteed revenue, then producers will receive a payment. However, payments are limited by a maximum payment rate, which until recently was set at 10% of the guaranteed value.
How the guaranteed revenue is determined is important for potential payments. The guaranteed revenue is calculated as a percentage of the benchmark revenue, which had been 86% until recently. The benchmark revenue is determined using an Olympic average of MYA prices and county yields. The Olympic average for prices is referred to as the benchmark price. The Olympic average for county yields is referred to as the benchmark yield. The benchmark price and benchmark yield are multiplied together to compute the benchmark revenue:
Benchmark Revenue = Benchmark Price x Benchmark Yield
Note that an Olympic average removes the highest and lowest values from a dataset. For ARC-CO, the Olympic average skips the previous year and uses the next five years’ worth of historical data. For example, to calculate the 2025 benchmark revenue, the 2024 production year would be skipped. An Olympic average for both prices and yields would then be calculated using 2019-2023 data.
An added feature in the calculation of a benchmark revenue is the inclusion of a price floor. Legislation requires that each year used in an Olympic average calculation must have a price no less than the statutory reference price. The statutory reference price was initially set in the 2014 Farm Bill with a price of $3.70 for corn and $8.40 for soybeans. To illustrate how the price floor works, the MYA price for corn in 2018 was $3.61, which is below the statutory reference price of $3.70. If 2018 were used in a benchmark revenue calculation, the $3.61 price would be replaced with $3.70. The use of a price floor helps keep the guaranteed revenue at a higher level.
ARC-CO changes explained
The recent changes to ARC-CO have affected both the guaranteed revenue calculation and the maximum potential payment producers can receive. These changes include:
- The guaranteed revenue has increased from 86% to 90% of the benchmark revenue.
- The maximum payment rate has been raised from 10% of the guaranteed revenue to 12%.
Another notable change is the impact that reference price updates will have on the benchmark revenue calculation. As part of the recent legislation, statutory reference prices were raised from $3.70 to $4.10 for corn and from $8.40 to $10.00 for soybeans. These prices are used to determine the price floor mentioned in the benchmark price calculation. However, based on existing legislation, the escalator clause referenced for the Price Loss Coverage (PLC) program can also be used in ARC-CO.
The escalator clause replaces the statutory reference price if 88% of a particular year’s historical Olympic average is higher than that reference price. Referred to as the effective reference price (ERP), the new price value is capped at 115% of the statutory reference price. The 2027 season is the first year that ARC-CO is expected to benefit from the price floor using an effective reference price. Figures 1 and 2 illustrate the potential impacts of an effective reference on the 2027 Olympic average for both corn and soybeans.
|
|
2027 Projected Olympic Averages |
||||
|
|
2021/2022 |
2022/2023 |
2023/2024 |
2024/2025* |
2025/2026* |
|
MYA Prices (Corn) |
$6.00 |
$6.54 |
$4.55 |
$4.31 |
$3.90 |
|
Effective Reference Price |
$4.10 |
$4.10 |
$4.10 |
$4.15 |
$4.42 |
|
Olympic Average (only MYA prices) |
$4.95 |
||||
|
Olympic Average (w/ ERP Floor) |
$4.99 |
||||
Figure 1. Increase in the Olympic average for corn with a price floor using the effective reference price. *Values based on projections from USDA.
In Figure 1, the Olympic average for corn in the 2027/2028 growing season is projected to be $4.95 per bushel. With a price floor based on only the statutory reference price of $4.10, the benchmark price would be set at $4.95. However, the effective reference price for 2025/2026 is projected to be $4.42. Since $4.42 is not the highest or lowest value, its use increases the Olympic average to $4.99 per bushel and sets a higher benchmark price. This leads to a net gain of $0.04 per bushel.
|
|
2027 Projected Olympic Averages |
||||
|
|
2021/2022 |
2022/2023 |
2023/2024 |
2024/2025* |
2025/2026* |
|
MYA Prices (Soybeans) |
$13.30 |
$14.20 |
$12.40 |
$10.00 |
$10.10 |
|
Effective Reference Price |
$10.00 |
$10.00 |
$10.00 |
$10.00 |
$10.71 |
|
Olympic Average (only MYA prices) |
$11.93 |
||||
|
Olympic Average (w/ ERP Floor) |
$12.14 |
||||
Figure 2. Increase in the Olympic average for soybeans with a price floor using the effective reference price. *Values based on projections from USDA.
In Figure 2, the Olympic average for soybeans in the 2027 growing season is projected to be $11.93 per bushel. With a price floor based on only the statutory reference price of $10.00, the benchmark price would be set at $11.93. However, the effective reference price for 2025/2026 is projected to be $10.71. Since $10.71 is not the highest or lowest value, its use increases the Olympic average to $12.14 per bushel and sets a higher benchmark price. This leads to a net gain of $0.21 per bushel.
Based on USDA projections, the use of an effective reference price in calculating the benchmark price will therefore lead to higher guaranteed revenues for both corn and soybeans. These higher guaranteed revenues should lead to higher support payments in years of substantial revenue losses.
While the amount of support payments could increase, the question remains: will ARC-CO make payments more often? This question is of special interest if market conditions like those seen during the 2018 Farm Bill period are repeated in the future.
Is ARC-CO really improved for corn?
To establish if ARC-CO will pay more often for corn growers and protect against market conditions seen between 2019 to 2024, a comparison using data from those years is helpful. For illustrative purposes, Cass County, Michigan data from 2019-2024 is used. Cass County tracks both irrigated and non-irrigated acres.

Figure 3 illustrates a comparison between actual payments made for non-irrigated corn acres in Cass County with payments that would have occurred given the 2025 OBBB updates. The first section highlights the change of the guaranteed revenue from 86% to 90% of the benchmark revenue. The second section outlines the actual payments generated under the 2018 Farm Bill guidelines compared to the 2025 OBBB updates. The most notable difference in the comparison can be seen in the 2019 and 2024 payments.
Corn received a payment of $26.75 per base acre in 2019 under the 2018 Farm Bill guidelines. Under the 2025 updates, the maximum payment rate increased from 10% to 12% of the guaranteed revenue. A maximum payment rate of 12% would have led to a payment of $55.57 per base acre, or a net increase of $28.82 per base acre. Note that even though payments have not yet been determined, the 2024 production year will still be calculated using the 2018 Farm Bill guidelines. As such, no payment is currently projected to be paid in 2024. However, if the 2025 OBBB updates were applied to the 2024 production year a payment of $31.33 per base acre would be paid.
For 2020 through 2023, no support was originally provided because the actual revenue did not fall below the guaranteed revenue. Under the2025 OBBB updates, actual revenue would still not fall below the guaranteed revenue. The net result is that support payments would still not be made from 2020 to 2023.
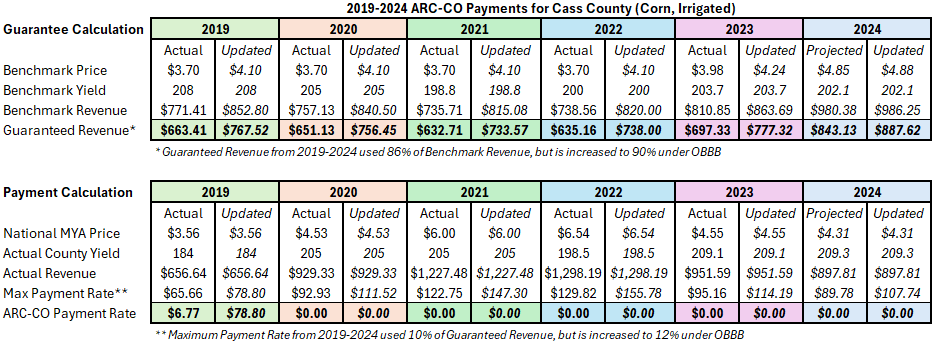
Figure 4 illustrates a comparison between actual payments for irrigated corn acres in Cass County and payments that would have occurred under the 2025 updates. A notable difference is seen in 2019 where an actual payment of $6.77 per base acre would be increased to $78.80 per base acre. The difference between the actual payment and the updated payment would have been a net increase of $72.03 per base acre under the 2025 OBBB updates.
Unfortunately, 2019 would have been the only year to receive benefits from the 2025 updates. Despite increases to guaranteed revenue and maximum payment rates, actual revenue would remain too high to lead to payments from 2020 to 2023. While the 2024 production year is not finalized, expectations are that it will also not receive a payment under either the 2018 Farm Bill guidelines or those updated in 2025.
This analysis highlights that under the OBBB updates, payments would have increased in 2019. However, ARC-CO would still not provide sufficient support to corn producers in Cass County under the market conditions of 2022 to 2024.
- Lost revenue for non-irrigated corn acres from 2022 to 2024 is $329.15 (average benchmark yield of 147.6 bushels multiplied by $2.23 per bushel price loss). Support would calculate to $31.33 per base acre solely from 2024. Base acre payments are also reduced to 85% of the payment rate, which decreases the $31.33 per base acre to only $26.63 payment against the $329.15 loss.
- Lost revenue for irrigated corn acres from 2022 to 2024 is $450.31 (average benchmark yield of 201.93 bushels multiplied by $2.23 per bushel price loss). With no payments generated in any of the three years, producers have no support against the $450.31 loss.
Overall, ARC-CO remains unable to provide timely support to corn producers facing dramatically falling prices.
Is ARC-CO really improved for soybeans?
To establish if ARC-CO will pay soybean growers more often and protect against market conditions seen between 2019 and 2024, a comparison using data from those years was also calculated. For illustrative purposes, Cass County, Michigan data from 2019-2024 is also used. The country tracks both irrigated and non-irrigated acres for soybeans.
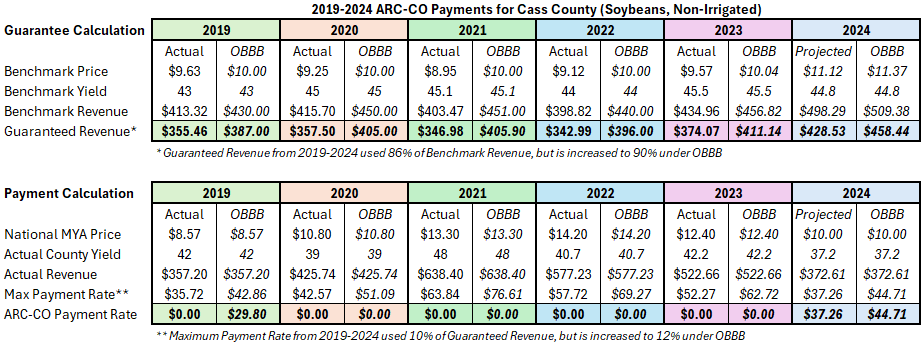
Figure 5 illustrates a comparison between actual payments made to non-irrigated soybean acres in Cass County with payments that would have occurred with 2025 updates. Similar to corn, the first section highlights the changes seen in the increase of the guaranteed revenue from 86% to 90% of the benchmark revenue. The second section outlines the actual payments generated under 2018 Farm Bill guidelines compared to the other 2025 OBBB updates.
The most notable difference is in the 2019 and 2024 payments. Non-irrigated soybeans did not receive payment in 2019 under the 2018 Farm Bill guidelines. Under the 2025 updates, a payment of $29.80 would have been made. Note again that even though payments have not yet been determined, the 2024 production year will still remain under the 2018 Farm Bill guidelines. Currently, a payment of $37.26 is projected to be paid in 2024. However, if the 2025 OBBB updates were applied for the 2024 production year, a payment of $44.71 would be paid. The difference would be a net increase of $7.45 per base acre.
For 2020 through 2023, no support was originally provided in those years because the actual revenue did not fall below the guaranteed revenue. Under the 2025 updates, actual revenue would similarly not fall below the guaranteed revenue and support payments would not be made.
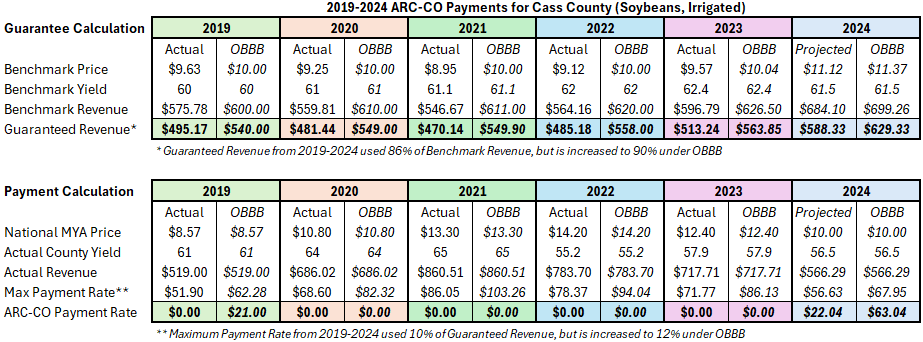
Figure 6 illustrates a comparison between actual payments with payments that would have occurred with 2025 updates, but for irrigated soybean acres in Cass County. Similar to non-irrigated acres, irrigated soybean acres would see increased benefits in 2019 and 2024. Irrigated soybeans did not receive payment in 2019 under the 2018 Farm Bill guidelines. Under the 2025 updates, a payment of $21.00 per base acre would have been made in 2019. For 2024, a payment of $22.04 per base acre is currently projected to be paid. However, under the 2025 OBBB updates, a payment of $63.04 per base acre would be paid for a net increase of $41.00 per base acre.
For 2020 through 2023, no support was originally provided in those years because the actual revenue did not fall below the guaranteed revenue. Under the 2025 updates, actual revenue would also not fall below the guaranteed revenue and support payments would not be made.
Similar to corn, this analysis highlights that under the OBBB updates, the amount paid to soybean acres would have increased in 2019. However, ARC-CO would still not provide sufficient support to soybean growers in Cass County under the market conditions of 2022 to 2024.
- Lost revenue for non-irrigated soybean acres from 2022 to 2024 is $188.02 (average benchmark yield of 44.76 bushels multiplied by $4.20 per bushel price loss). Support calculations would be only $44.71 per base acre, all from 2024. Base acre payments are also reduced to 85% of the payment rate, which decreases the $44.71 per base acre to only $38.01 payment against the $188.02 loss.
- Lost revenue for irrigated soybean acres from 2022 to 2024 is $260.26 (average benchmark yield of 61.96 bushels multiplied by $4.20 per bushel price loss). Comparing the sole support calculation of $63.04 from 2024, the 85% payment rate would reduce support to only $53.58 per base acre against the $260.26 loss.
Therefore, ARC-CO also remains unable to provide timely support to soybeans producers facing dramatically falling prices.
Looking forward to future ARC-CO payments
The ARC-CO program payments require actual county revenue losses, between yield and price, to be greater than 10% of the guaranteed revenue. If either yield or price is high enough to keep revenue losses at or below 10%, no support is expected.
Based on USDA price projections, market-year-average prices have the potential to generate ARC-CO payments in the next several years even if county yields are above average. Figures 7 and 8 outline the projected price losses for corn and soybeans, respectively, from 2025 through 2029.
|
|
Projected Corn Price Losses 2025-2029 |
||||
|
|
2025/2026 |
2026/2027 |
2027/2028 |
2028/2029 |
2029/2030 |
|
MYA Prices (Corn) (Projected) |
$3.90 |
$4.00 |
$4.10 |
$4.20 |
$4.30 |
|
Benchmark Price (Projected) |
$5.03 |
$5.03 |
$4.99 |
$4.46 |
$4.40 |
|
Price Loss (MYA ÷ Benchmark Price) |
-22% |
-20% |
-18% |
-6% |
-2% |
Figure 7. Projected price losses for corn from 2025-2029 based on projected benchmark prices and market-year-average prices. All values are based on projections from USDA.
Figure 7 outlines potential price losses for corn from 2025 to 2029 based on market-year-average prices and benchmark prices. Benchmark prices are highest for 2025 through 2027 based on the Olympic averages for each year factoring in market-year-average prices from 2019-2025, which include the price losses seen from 2022 to 2024. If actual yields within a county remain close to benchmark averages, support payments could be triggered solely on price for all three years. By 2028, the price losses from 2022 to 2024 begin to phase out of the Olympic averages. This results in price losses falling below the 10% threshold. For support payments to activate in 2028 and 2029, lower yields would also have to occur.
|
|
Projected Soybean Price Losses 2025-2029 |
||||
|
|
2025/2026 |
2026/2027 |
2027/2028 |
2028/2029 |
2029/2030 |
|
MYA Prices (Soybeans) (Projected) |
$10.10 |
$10.00 |
$10.00 |
$10.00 |
$10.30 |
|
Benchmark Price (Projected) |
$11.90 |
$11.90 |
$12.14 |
$11.27 |
$10.64 |
|
Price Loss (MYA ÷ Benchmark Price) |
-15% |
-16% |
-18% |
-11% |
-3% |
Figure 8. Projected price losses for soybeans from 2025-2029 based on projected benchmark prices and market-year-average prices. All values are based on projections from USDA.
Figure 8 outlines potential price losses for soybeans from 2025 to 2029 based on market-year-average prices and benchmark prices. Benchmark prices are highest for 2025 through 2028 based on the Olympic averages for each year factoring in market-year-average prices from 2019 to 2026. Similar to corn, the Olympic averages include the price losses seen from 2022 to 2024. If the actual yield within a county remains close to benchmark averages, support payments could be triggered solely on price for four years. By 2029, the price losses from 2022 to 2024 will have phased out of the Olympic averages. This will also result in price losses falling below the 10% threshold. For support payments to activate in 2029, lower yields would also have to occur.
Like most risk management programs, support is seldom needed when yields and prices are stable or higher than expected. The true test of a support program is how it responds when producers need it most. When extreme weather and market conditions exist, revenue support programs like ARC-CO are needed to provide protection.
Yields can vary not only between counties, but within a county itself. How a farm’s historical production aligns with county yields is an important factor in establishing ARC-CO’s ability to protect against losses. Farm managers are encouraged to compare individual yield records with county records. If production levels are similar, ARC-CO can be a source of risk protection against yield losses.
While protection from yield losses remains a relevant feature of ARC-CO, analysis indicates that program updates do not immediately offer protection against extreme market conditions. Especially when rapidly falling prices occur, such as seen during 2022 to 2024. ARC-CO eventually will consider those conditions, but support may not arrive for several years after they occur.
On the other hand, the improvements made to the guaranteed revenue and maximum payment rates should generate higher payment rates when support is triggered. However, analysis also indicates that updates to ARC-CO will not increase the frequency of how often producers receive payments. This indicates that ARC-CO will continue to offer limited support in the future.
Producers are encouraged to use the 2025 season as a potential indicator of future program support. Regardless of initially choosing between Price Loss Coverage (PLC) and ARC-CO, producers will automatically receive the better payment rate between the programs. PLC received its own improvements to program support, which focus solely on market prices. Receiving the better payment between programs in 2025 provides an opportunity to compare each program directly. That comparison may be helpful for future program sign-up decisions. Producers will need to choose between the two programs again in 2026.