Quantifying the Scale and Scope of Nutritious Cowpea Products in Local Markets of West Africa
Quantifying the scale and scope of nutritious cowpea products in local markets of West Africa
Research Protocole: Part I
Aliou Diagne, Melinda Smale, Véronique Thériault and Idrissa Wade
December 2020
1. Introduction
Cowpea, known locally as niébé, is the most important indigenous grain legume in West Africa both in terms of food security and income generation for smallholder farmers (CNFA 2016; Mishili et al., 2007; Langyintuo et al. 2003). In Africa, the crop is grown primarily in West and Central Africa with an estimated average annual production of 2.6 million tons for both regions for the years 1990-1999, representing 69% of the cowpeas produced in the world at that time (Langyintuo et al. 2003). Close to two thirds of the region’s cowpeas production took place in Nigeria (66%), far more than what was produced in Niger, the second largest producer with 14% of the region’s total production. [1]
According to current FAOSTAT data in 2016-2018, the West Africa region (including Burkina Faso, Ghana, Guinea-Bissau, Mali, Mauritania, Niger, Nigeria and Senegal) produced a three-year annual average of 5.8 million tons of dry cowpeas, representing 83% of the world’s total. Nigeria and Niger each produced over 2 million tons per year on average from 2016-2018. Today, Africa as a continent produces 96% of global output. Our study countries, Senegal and Mali, produced only 2% and under 1% of the world’s total. [2]
Cowpea is particularly adapted to the agro-climatic condition of the Sahel because of its drought tolerance, relatively short-production cycle (60-80 days) and good integration into farmers crop diversification strategies (Inaizumi et al., 1999).[3] Cowpea is also a dual-purpose food crop used for both human food (the leaves and grains) and animal feed (the leaves and shoots). For these reasons, Inaizumi et al., (1999) found that farmers who adopted dry-season dual-purpose cowpea gained several benefits. These included a food source during a critical period of the year when other crops (such as cereals) have not matured, fodder and in situ grazing for livestock after harvesting, cash income from sales of cowpea grain or fodder when their prices peak, and good quality fodder when it is scarce.
From the perspective of human consumption, cowpea is an affordable source of high-quality protein and other nutrients for both urban and rural households Dovlo et al. (1976). This explains why it is commonly known in Hausa as naman talaka—meaning “poor man’s meat” (Robinson et al. 2014). Cowpea grains are rich in micronutrients with nutrient density depending on the variety. The leaves and young shoots of the cowpea plant, which are particularly high in iron and calcium (Madodé et al. 2011), are often added to the stews consumed with starchy staples by families (in addition to being used as fodder for small ruminants). There are also numerous food products that are prepared from cowpea grain. Dovlo et al. (1976) recorded more than 50 cowpea-based products consumed in West and Central Africa and a recent report by CNFA (2016) lists 32 cowpea dishes that are sold by women entrepreneurs in markets and various retail outlets of Niger.
This brief account of what is known about cowpeas from the literature shows the potential for cowpea to contribute significantly to improved well-being of West African populations from both food security and economic standpoints—if the various constraints hindering wider production and consumption are identified and alleviated.
Much of the research on cowpea has been focused on addressing the biotic and abiotic constraints to raising yield, breeding to develop new varieties, and understanding the constraints to their adoption by farmers (DRG CRSP and LIL 2018). Besides the adoption studies, the socio-economics research that has been conducted so far has consisted largely of mapping value chains actors and trade patterns or applying hedonic analysis to cowpea grain characteristics and markets prices data to identify consumer preferences for grain traits that can be used to orient cowpea breeding.
Recently, studies have explored the range of value-added products offered by differentiated private and public, formal and informal actors in value chains, also highlighting the role of women entrepreneurs. Market-based incentives for cowpea products other than grain, including leaves, processed and nutritious products have received less research attention.
In fact, we know little in quantitative terms about the scale and scope of cowpea products, and especially processed products, in local markets. We need a better understanding of the potential for engaging a diversity of private and public sector actors, including small-scale enterprises led by women, in cowpea-related business opportunities. Our research in Mali and Senegal seeks to close the information gap by building a quantitative inventory of cowpea products supplied and demanded in local markets.
Although they are not the largest producers of cowpea grain in the region, both Mali and Senegal are experiencing the dietary changes that reflect unprecedented rates of urbanization and income growth. There is a growing demand for diversified and easy-to-prepare foods, including cowpeas and cowpea-based, processed products (Hollinger and Staatz 2015; SIM/CSA 2019).
1.1. The cowpea supply chain: market structure and actors
Based on in-depth research that began in the mid-1990s, Langyintuo et al. (2003) provide a good description of cowpeas grain marketing in West and Central Africa (see also Wade and Dia 2011, and Faye 2005). In general, three types of traders are involved in moving cowpeas from producers to consumers both within and outside the main producing regions: At the beginning of the marketing chain are assemblers (or collectors –as they are called in Senegal) who buy from farmers in rural markets. These assemblers are mostly men travelling from one rural market (in the producing zones) to another where they meet farmers coming from nearby villages to sell their marketable surpluses of grain cowpeas (usually in relatively small quantities). In general, assemblers are not specialized in specific crops and, depending on the period, location and capacity; one assembler may collect, in addition to cowpeas, millet/sorghum, maize, and groundnut during the same visit to a market. Many farmers sell their surplus cowpeas and cereals in small quantities during several visits to markets depending on needs for cash (see also Wade and Dia 2011; Mishili et al. 2007; Faye 2005).
Next in the marketing chain are wholesalers who buy from assemblers directly or through commission agents (Langyintuo et al. 2003). The wholesalers are usually located in urban centers in cowpea production zones or in the countries’ capital cities.[4] They have the means to stock large quantities of cowpeas grains during the peak marketing season (October to January) which they can sell later when market prices are high. Some of the wholesalers have networks of assemblers whom they provide the necessary working capital as credit on condition that the assemblers purchase purchase exclusively from them. Retailers are at the end of the marketing chain and buy from the wholesalers to sell to rural and urban cowpeas consumers. Retailers are found in all types of markets in both cowpea producing and non-producing zones, including both small and large markets in either rural or urban areas.
[4] Some urban centers and rural towns are known within the countries (and sometimes outside) for their high concentrations of cowpeas wholesalers (e.g. Louga and Touba in Senegal and the Dawanau Market in Kano in northern Nigeria) (see Mishili et al., 2007; Faye, 2005)
In general, women are actors throughout the cowpea value chains of West Africa. They can be found as assemblers buying from farmers in village centers or on roadsides (Langyintuo et al., 2003). In Ghana, cowpea grain retailers are mostly women and some are also found as wholesalers (Mishili et al. 2007). They also play a central role in home-processing and sales of cowpea-based products across West and Central Africa (CNFA, 2016; Ibro et al. 2006, 2008; Otoo et al. 2001).
1.2. Consumer demand for cowpea grain
Results of hedonic analyses reported by Langyintuo et al. (2003) demonstrated that seasonal supply, grain size, color and extent of insect damage explained much of the price variability in markets surveyed in Cameroon, Ghana, Senegal and Nigeria. Researchers estimated that consumers were willing to pay premiums for each gram increase in 100 grain weight, but that consumers valued grain characteristics such as black eyes differently across countries.
In Senegal, Faye et al. (2004) also used a hedonic pricing model to demonstrate that consumers paid a premium for large grain size and preferred certain colors and textures, avoiding grains damaged by insects. The authors found that prices in different markets were not equally responsive to shifts in supply of cowpeas. Mishila et al. (2009) examined similar data from six markets in Ghana, two markets in Mali and three markets in Nigeria. Findings were consistent with those reported in other studies: cowpea consumers are willing to pay a premium for large, insect-free grains. Preferences regarding skin and eye color were variable. Thus, storage technologies were recommended, along with breeding for grain size and a portfolio of color and texture combinations.
Since then, CNFA (2016) has reported several “end market” analyses led by Purdue and conducted by other organizations in Burkina Faso, Ivory Coast, Ghana, Niger and Nigeria. Most of these are unpublished monographs. Later studies have largely confirmed the foundational work undertaken by the USAID Cowpea/Bean CRSP regarding consumer preferences for cowpea grains.
1.3. Consumer demand for cowpea-based products
Although the share of the household budget allocated to cowpeas is still relatively low compared to other food staples, income growth and urbanization appear to be contributing to growing demand for protein (Hollinger and Staatz 2015). With urbanization, consumer preferences are evolving towards meals that are quick and easy to prepare. Cowpeas lend themselves to value-added products like quick-cook couscous, dumplings, cooked dough (beignet), and flour. Products now include fortified, nutritious products of various kinds with actors including various types of traders, small-scale enterprises now managed by women, and women street vendors.
CNFA (2016) notes that women are fully involved in cowpea value chains and run their own businesses; also reporting that among processed foods, a new value-added product is specially blended, milled flours that are suitable for newborns, diabetics, and those with compromised immune systems. In Niger and Burkina Faso, individual women entrepreneurs and women’s groups process cowpea into value-added food products and package them for sale. CNFA (2016) mention one female-owned company in Niamey that uses modern industrial milling methods to produce 1-kg bags of cowpea flour, and SODEPAL in Burkina Faso, which supplies cowpea biscuits to schools and supermarkets. The report describes female entrepreneurs who purchase cowpea daily from the central or neighborhood market, pound the cowpea into flour and make it into beignets or other, consumer-ready products. Ibro (2006) and Otoo (2011) estimated that 1300 to 1600 women in Niamey were selling these types of products. Cissé (2015) describes women’s businesses of this type in Mali.
Value-addition offers opportunities for the small-scale entrepreneurs in the private sector to make higher profits and seize market share. Yet, since the in-depth research on consumption preferences for cowpea grains undertaken in the early 2000s, little has been documented in quantitative terms about the scale and scope of cowpea and cowpea-based processed products currently available to consumers. New research is needed to better understand business opportunities for private sector engagement in producing and marketing cowpea-based, value-added products to final consumers.
The objective of the research for which this research protocol has been developed is to expand the array of cowpea-based products considered in quantitative market analyses, as well as to better characterize the diversity of actors in local markets, with the purpose of recommending inclusive partnerships to develop local markets for nutritious products. More precisely, the research objectives are to:
- characterize the scale (quantities and geographical extent) and scope (product differentiation) of cowpea traded in key market hubs and surrounding satellite markets of study countries;
- gain insights regarding changing consumer preferences and current consumption of a broader range of cowpea products supplied to these markets; and
- identify opportunities to expand consumer demand for value-added cowpea products, with a particular focus on nutritious product.
While conducting the research, the team seeks to strengthen the capacity of local partners to conduct market analyses, assess consumer demand, and implement policy research using innovative methods and tools. Based on the research, the team aims to derive implications for the potential of private and public sector engagement in the production and marketing of value-added, cowpea-based products at various nodes in the value chain.
2. Methodology
The team will collect quantitative data through structured questionnaires and representative samples of market actors and potential cowpeas consumers in order to assess
- the actual and potential market sizes and geographical distribution of cowpeas-based products (in terms of actors, product diversity and quantities traded) as well as the factors determining these supply-side outcomes, and
- the actual and potential demand for cowpea-based products (in terms of consumer population size, heterogeneity along several dimensions and quantities demanded) along with the factors determining the demand side outcomes.
2.1. Study Populations and Sampling
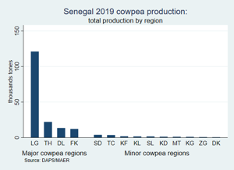
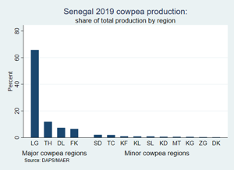
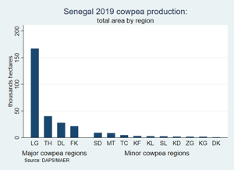
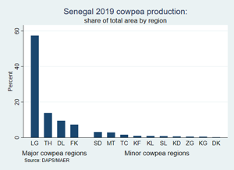
As is the case in the rest of West Africa, cowpea is the second most important grain legume crop in Senegal with total production estimated at 184,137 tons for 2019 (Figure 1). As Figure 1 shows, close to 92% of Senegal’s cowpeas is produced in only 4 regions (out of 14): Louga (66%), Thies (12%), Fatick (7%) and Diourbel (7%). The share of national production for the other 11 regions does not exceed 2% each.
Besides cowpea producers, the other populations involved in the marketing of cowpea-based products are cowpea grain traders and sellers of processed cowpea-based products on the supply side and consumers of both products on the demand side.
2.1.1. The cowpea grain traders
On the supply side, the summary review in the introductory section above has identified three subpopulations of traders involved in the marketing of cowpeas grains: collectors, wholesalers and retailers. We need to collect data using representative samples from all the three sub-populations in order to estimate reliably the relevant population parameters in i) above and answer the research questions.
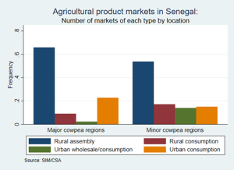
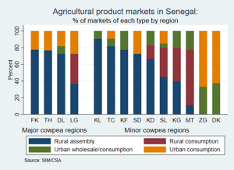
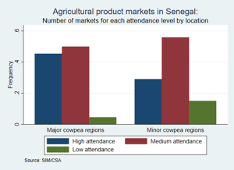
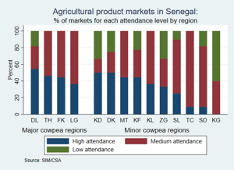
The Senegalese Market Information System of the Food Security Commission (SIM/CSA) has classified the markets in Senegal into 5 categories where agricultural products are traded (SIM/CSA, 2019):[5] 1) rural assembly markets, 2) rural consumption markets, 3) urban mixed wholesale/consumption markets, 4) urban consumption markets and 5) border markets. Figure 2 presents the number of markets in each category and the level of attendance by market actors.
Rural assembly markets
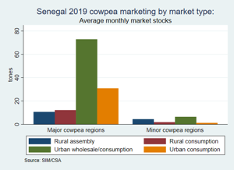
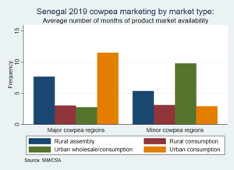
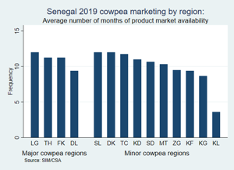
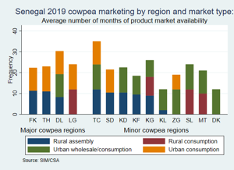
In Senegal, the rural assembly markets where farmers sell their grain surpluses to so-called “collectors” (i.e. assemblers) operate generally on a weekly basis (SIM/CSA, 2018, Wade and Dia, 2011; Faye, 2005). For that reason, they are called weekly markets. They serve large clusters of neighboring villages in agricultural production surplus zones and are held in rotation in different villages (or towns) and days of the week. Figure 2 shows that the rural assembly markets are located almost exclusively in the major cowpea production regions where they form the most important category of markets both in terms of number (Figures 2a and 2b) and attendance (Figures 2c and 2d). But, in terms of market stocks, their relative importance in both the major and minor cowpea production regions is far less compared to the wholesale markets and, to a lesser extent, the urban and rural consumption markets (Figures 3a and 3c). On the other hand, in terms of cowpea availability in the market during the year there is not much difference among the market types (Figures 3b and 3d). Hence, cowpea assembly markets serve mostly as points of collection but not storage.
As described earlier, the main role of collectors in the agricultural product marketing chains consist of travelling from one weekly market to another. Usually, they buy relatively small quantities from individual farmers, which they assemble into larger quantities destined for wholesalers in urban markets (SIM/CSA, 2018, Wade and Dia, 2011; Faye, 2005). Some collectors work as agents for particular wholesalers who provide them with the necessary funds to collect grain. Other collectors work on their own but are often financed by wholesalers with whom they are required to sell exclusively at negotiated price margins. Usually, the same set of collectors operates within a well-defined, delimited geographical area in zones of production surplus for specific crops (these may span more than one administrative region). Each geographical area is known to generate marketable surpluses for specific crops. In Senegal, cowpea grain collectors are concentrated in the four main cowpeas producing regions as identified above[6]: Louga, Thies, Diourbel and Fatick.
Rural consumption markets
In contrast to rural assembly markets, the rural consumption markets are located in production deficit zones. They are called rural consumption markets (for a specific product) because in general only retail traders serving rural consumers are found in those markets. Like the assembly markets, rural consumption markets are also weekly markets where farmers in neighboring villages buy and stock up on food they do not produce on a weekly basis. Also, like collectors, rural retailers travel from one weekly consumption market to another within the same geographical area. In Senegal, the consumption markets for cowpeas are in general located in the regions outside the 4 main producing regions listed above although we may find many of them in the cowpea producing regions (Figure 2a and 2b). [7] In fact, some of the markets in the cowpea producing regions may play both assembly and consumption roles because not all farmers in the regions are cowpea producers. We may find both cowpea collectors and retailers in the same markets.[8] Furthermore, the same trader can operate as a collector during the peak marketing season (October –January) and as a retailer when there are not many farmers with marketable surpluses to sell.
Urban mixed wholesale-consumption markets
The urban mixed wholesale-consumption markets are the places where the wholesalers are found. As mentioned earlier, in general wholesalers of agricultural products are located in the major urban centers in the crop production zones and the capital city. As Figure 2b shows, the cowpeas grain wholesalers in Senegal are found in the principal urban markets of Diourbel and Dakar regions.[9] The wholesalers operate at a much larger geographical scale than the collectors and nationally in many cases. The wholesalers are the central supply points for semi-wholesalers and retailers which operate in the same markets as wholesalers or in secondary retail markets that serve consumers.
Urban consumption markets
These consumption markets are situated in both cowpea production and non-production zones (Figures 2a and 2b). Generally, they are purely retail markets that differ from the urban markets where the wholesalers are located. These urban consumption markets operate largely on a permanent basis (unlike the weekly rural markets) and they host traders who are exclusively retailers selling directly to consumers.
To summarize, the main characteristics of the populations of cowpea grain traders are as follow:
- Cowpea grain traders (collectors, wholesalers or retailers) are not usually specialized in cowpea grain trading. In particular, they are also engaged in the trading of the main locally produced cereals (millet/sorghum, maize and rice) and groundnut depending on location.[10] In fact, for most traders, cowpea grain plays a relatively minor role compared to the other cereals, except perhaps in few markets located in areas where cowpea production is dominant (mostly in the Louga and Diourbel regions). [11] For that reason, it is far more common to find collectors and wholesalers who do not trade cowpea grain than those specialized in cowpea trading.[12]
- The three subpopulations of cowpea grain traders are overlapping. Many collectors are also retailers depending on the season. Similarly, almost all wholesalers operate also as retailers on a permanent basis. Furthermore, some wholesalers in some of the main markets are also collectors in the sense that some farmers sell their marketable surpluses to them directly.[13] On the other hand, the vast majority of retail traders do not operate as collectors or wholesalers. In fact, this subpopulation of exclusively retail traders is by far the largest.
- The collectors are in general located in rural assembly markets, although a few of them (wholesalers operating also as collectors) can be found in the urban wholesale and consumption markets. The wholesalers are found in only the main urban wholesale and consumption markets.[14] In contrast, retail traders are found in all 5 categories of markets (including the rural and urban border markets).[15]
The above considerations lead us to adopt for sampling and analysis purposes the following definitions as distinguishing characteristics of the constituting elements of our three overlapping populations of grain traders:
- Collector: any trader who buy marketable agricultural product surpluses from farmers during the year
- Wholesaler: any trader who sells to retail traders
- Retail trader: any trader who sells directly to consumers
- Cowpea trader: a trader who trades cowpea (exclusively or not) at least part of the time during the year
2.1.2. The vendors of cowpea-based processed products
The cowpea-based processed products known in Senegal are mainly (Wade and Dia, 2010; Faye, 2005): 1) cowpea flour obtained from the cowpea grain through an artisanal or semi-industrial milling process[16], 2) cowpea beignet known as “akara” prepared with the cowpea flour and sold in the streets by women food vendors, and 3) cowpea stew known as “ndambe” prepared with cowpea grains with other ingredients (meat, cassava or sweet potato, tomato, etc..) and sold by street food vendors (mostly women) or in some local restaurants.
The most common place where cowpea flour is sold is in local markets, and mostly by retail traders of raw agricultural products and process packaged food, including cowpea grain traders. Cowpea flour requires decent storage facilities to be conserved for more than few weeks without being spoiled. For this reason, few retail traders in local markets are selling it. Another place, where cowpea flour is found is in neighborhood stores where they are sold in a package. Well packaged cowpea flour is also sold in most supermarkets and mini markets in urban cities.
The two other cowpea-based processed products are sold mostly by women food vendors in local markets, in the streets of most neighborhoods in urban cities and in local restaurants (for “ndambe” only). “Ndambe” is becoming a popular food consumed with bread as sandwich for breakfast away from home.
2.2. Sampling Methodology[17]
Given the above description of the structures of cowpea grain production, marketing and population of traders, the best sampling strategy that enables us to get representative samples of our three study populations of grain traders is a multi-stage stratified cluster random sampling one, with different probabilities of selection of clusters and population units (i.e. traders). Under this sampling strategy, we have the 14 regions of Senegal constituting the first level strata of the stratification scheme of our study population of traders. In the second level of the stratification scheme, we have within each region strata, the populations of markets which are classified into 5 different categories by SIM/CSA as described above. In the third level of the stratification scheme we have within each market category the individual markets within which the traders are located and with each grain trader operating possibly (and non-exclusively) as collector, wholesaler and/or retailer.
It is important to note that in the above three-level stratification scheme, we may not find all the 5 categories of markets in some region strata. For example, there is no rural assembly market in Dakar. Furthermore, we should point out that a market can be characterized as both an assembly and consumption market (in the rural zone) or as both wholesale and consumption market (in the urban setting) depending on the nature of the trading activities taking place in the market. However, for the purpose of sample selection, we will apply the SIM/CSA classification which assigns a market to a unique category based on the dominant trading activity in the market.
From the stratification scheme above, we can consider four possible alternatives multi-stage stratified cluster random sampling schemes with all based on i) first level region stratification and ii) cluster random sampling of markets (a market being a cluster of traders of various products), with a selection probability for each market given by its market population weight calculated as described below. Also, in all four alternatives the sample selection of the population units of traders involves at least three stages. The differences among them lie in whether we use additional stratifications beyond the region based on the categorization of markets and/or traders as described above:
- Sampling method S1: The first alternative sampling method (referred to as S1 hereafter) involves three stages. Stage 1 is stratification by region. In stage 2, select within each region a random sample of individual markets as clusters of traders regardless of market category. In the third stage, within each selected market cluster, select a random sample of traders without consideration of the trader type (collector, wholesaler and retailer).[18]
- Sampling method S2: The second alternative sampling method (S2) involves three stages after regional stratification. First, further stratify each region stratum into five sub-strata based on the market categorization (rural assembly, rural consumption, urban wholesale/consumption, urban consumption, rural border and urban border).[19] In the third stage, within each sub-strata market category, select a random sample of individual markets (the clusters) as in stage 2 of the sampling method S1. In stage 4, a random sample of traders without consideration of trader type as in stage 3 of sampling method
- Sampling method S3: The third alternative sampling method (S3) also has three stages after regional stratification. The first two stages are the same as in sampling method Instead of randomly selecting traders directly within each selected market, each market is stratified in a third stage based on the 3 trader types: collectors, wholesalers, and pure retailers.[20] Then, in an additional stage 4, a random sample of traders is selected within each strata of trader type.
- Sampling method S4: The four alternative sampling method (S3) has five The first three stages of are the same as in sampling method S2. The last two stages are the same as in sampling method S3.
The four alternative sampling methods considered above differ in terms of level of complexity with respect to i) sample selection implementation (with S1 being simplest, followed by S2, S3 and S4, respectively),[21] ii) survey implementation logistics and costs (with in general, S1 being logistically the most complex and costly to implement, followed by S2, S3 and S4, respectively) and, iii) desired statistical properties of estimators in terms of efficiency as measured by sampling variance (this depends on the degree of heterogeneity in the market and traders populations (within the relevant strata) and the market intra-cluster correlation coefficients.[22]
Considering the relative advantages/disadvantage of each sampling methods in terms of the above criteria as well as the existing logistical infrastructures of the SIM/CSA, the partner through which the survey is going to be implemented, we can opt for the sampling method S4 with the following two modifications:
- First, the collectors and wholesale sub-populations of traders are pooled within each region stratum across market categories and market clusters. The collectors and wholesale traders’ samples will then be randomly selected from these regionally pooled subpopulations, respectively. For the retail traders, the sample selection will proceed exactly as described in S4 above. This modification is justified by the fact that the sizes of the sub-populations of collectors and wholesalers in a given region are relatively small, making any stratification beyond the region unfeasible. The modifications are further justified by the facts that a) the same collectors are found in all the markets in a region and b) a wholesaler generally operates on a regional or even a national basis. This modification is not needed if it is decided to exclude collectors and wholesalers in the sample.
- Second, in choosing the sample traders within each trader-type stratum, a further stratification may be conducted according to cowpea trading status of traders before selecting traders within each cowpea trading status stratum. The reason for this additional layer of stratification is to ensure the inclusion of enough cowpea traders (of each trader type) in our sample in case a region’s population of cowpea traders is found to be very small. The desirability and appropriateness of such modification will be determined after an exploratory survey of the markets is conducted.
The implementation of this modified sampling method S4 (which we will continue to refer to as simply S4) hinges on the availability of sampling frames for: i) the collectors and wholesalers sub-populations in each region, with information on the cowpea trading status of traders (if they will be included in the sample), ii) all the markets in each region with the relevant market category information and additional information needed to calculate their population weight of each market (see below). We can note that with the chosen sampling method, a full sampling frame of retail traders in a region is not needed. All that is needed is the sampling frame of retail traders in each randomly selected market cluster. This is a less onerous task which can be implemented during the survey.
To establish the sampling frames of collectors and wholesalers in each region (in case these two subpopulations of traders are included in the survey), we propose to proceed as follows. First, we start by constructing the sampling frame of wholesalers for each region with the relevant trader-strata information and contact details (telephone in particular). Once, we have a complete list of wholesalers for each region, we contact each wholesaler in the list to ask him or her to provide the name and contact details of each collector they are dealing with. We can then in turn contact each wholesaler-known collector to ask him or her names of fellow collectors they know. This process of “contact-tracing” of collectors through wholesalers and chain of collectors can be continued until we have a stable and unchanging list of collectors for each region. In this way, we should be able to get the majority of collectors operating in any given region. These two tasks can be easily accomplished through the network of SIM/CSA market monitors and supervisors.[23] Then, the few remaining collectors (if any) can be discovered through a rapid exploratory survey of markets in the main cowpea producing regions implemented before undertaking the survey. The same network of SIM/CSA market monitors and supervisors can also help establish a sample frame of all existing markets in Senegal as exhaustively as possible, if not completely. The wholesalers and collectors in the constructed sampling frames can also be contacted one by one to check for any eventual market omitted by the network of SIM/CSA market monitors.
This supposes that everything else is equal and the sample frames are readily available. Otherwise, one cannot avoid some form of tradeoff.
2.3. Market population weights and sample selection probabilities
As explained above, the sampling methods S1-S4 are all based on stratified cluster random sampling of retail traders. The clusters, which are markets, are each selected randomly with a selection probability given by its market population weight. This raises the question of how this market population weight is calculated. We consider three alternative measures of market population weights, each aimed at capturing some aspect of the relative importance of a market in the cowpea trading activity. The first measure is a rating of the markets in terms of attendance level by market actors (high, medium, low) as given by the SIM/CSA. The second measure is the average monthly quantities of cowpea traded in the market in 2019. The third measure is the number of months the cowpea product was available in the market in 2019 (out of 12). We have also computed two additional measures of market population weight by combining the second and third measures and by combining all three measures. The details of the computation of the market population weights are provided in Appendix 1.
The first measure is the closest measure of the population size of the traders in the market among the three measures (although it includes other market actors).[24] Another advantage of this measure in our case is the fact that it is available for all the 137 markets (SIM/CSA monitored and non-monitored) that has been compiled by SIM/CSA for the purpose of this protocol. In contrast, the other two measures (and their combinations) are available only for the 45 markets monitored by SIM/CSA.
2.3.1. Market population weights using the incomplete lists of markets
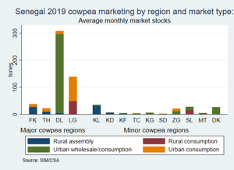
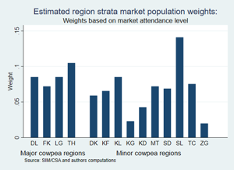
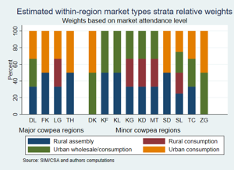
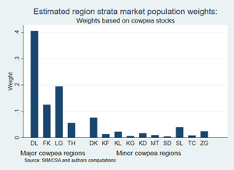
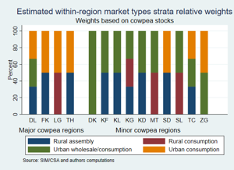
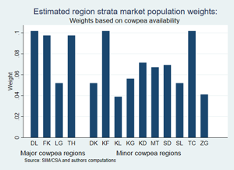
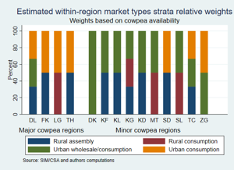
The graphs in Figures 4a - 4f show the sum of the market population weights of each region’s markets included in the list of 137 markets compiled by SIM/CSA. The graphs also show for each region the relative shares of the population weights of the markets in each market category. One striking fact in Figures 4a and 4b, which show market population weights based on market attendance, is the preponderance given to the Saint-Louis region. Saint-Louis has the highest weight even though it is neither among the major cowpea-producing nor the highest cowpea-consuming regions. By contrast, the market population weights estimates based on cowpea market stocks and months of availability give more importance to the markets in major cowpea producing regions along with markets in Dakar, where the key wholesale and consumption markets are located (Figures 4c -4f). These figures look more realistic than those based on market attendance. However, the market populations weights estimates based on the average monthly market cowpea stocks for Diourbel (.41) and Louga (.20) are far too high (Figures 4c - 4d). In that regard, the weights based on the number of months of cowpea availability appear more balanced, except that they show markets located in two of the minor cowpea producing regions (Kaffrine and Tambacounda) to have disproportionately high weights—higher than those located in the major cowpea regions—except Diourbel (Figures 4e - 4f). The combination of the two weights (based on market cowpea stocks and months of availability) and that of the three weights (based on market attendance, cowpea stocks and availability) show both estimates of market population weights to be very similar to the weight based on market stocks only (Figures 5a -5d). We have used the weights based on market cowpea stocks as a basis for the estimation of market sample selection probabilities presented in Table 1.
Table 1 gives the summaries by region and market category of the estimated market sample selection probabilities based on the market cowpea stocks measures of population weights as described above. Except the cells in the last column and cells in the last row, each cell of the table represents the sum of the selection probabilities of all the markets in a market category in a given region[25]. The cells in the last column give the sum of the selection probabilities of markets in each region (across market categories), while the cells in the last row give the selection probabilities for markets in each category (across region).
With the stratification by region and selection of clusters (i.e. markets) within each region (with equal cluster size within and across regions), the results in Table 1 imply the following allocation of the full sample of markets and traders by region: Diourbel (41% of the sample), Louga (20%), Fatick (12%), Dakar (8%), Thies (6%), Saint Louis (4%), Kaolack, Kolda, and Ziguinchor (2%); Matam, Kaffrine, Kedougou, Tambacounda (1%) and Sedhiou (0). As we can see, this allocation of the sample markets concentrates almost all the sample in 6 regions (the four major cowpea production regions plus Dakar and Saint Louis). Such a sample would be highly questionable given the sizable quantities of cowpeas traded in markets outside the major cowpea production regions (Figure 3). Furthermore, the feasibility of implementing such sample selection of markets is doubtful as it requires, for a sample size of 100 markets, selecting 41 markets in Diourbel and 22 markets in Louga. It is unlikely that we can find such high number of markets to survey in these two regions.
Hence, using with the SIM/CSA market list and market attendance level with cowpea stocks and availability is not likely to generate a representative sample of markets and retail traders for the study. A closer look at the market attendance data reveal that the preponderance of the Saint-Louis region is due to its overrepresentation in the existing list of 137 markets compiled by SIM/CSA, with 21 markets (15% of the total). By comparison, there are fewer markets in the list located in the major cowpea regions of Louga (11), Diourbel (11), Thies (13) and Fatick (9). Other minor cowpea producing regions seem also to be overrepresented in the list (Tambacounda, Sedhiou and Matam). The pattern of overrepresentation is likely due to the way the list was compiled, with the SIM/CSA market monitors being more knowledgeable of the markets existing in their own regions than in others. This means that without a complete list of markets, the market population weights based on market attendance are misleading and inappropriate as the sole basis for market sample selection probabilities.
2.3.2. Market population weights using a more complete list of communal markets
To develop a more complete list of markets, we use the administrative unit of the commune. Each of 14 regions in Senegal is divided into departments which are in turned divided into arrondissements with the latter divided into communes. There are in total 552 communes in Senegal. In the rural areas, a commune regroups several villages while in urban areas a commune is best described as a cluster of densely populated neighborhoods. The communes are governed by elected council members led by a mayor (elected among the council members). Every market in Senegal depends administratively on one commune, which has the power to regulate its functioning and collect taxes and fees from traders operating in the market. In rural areas, the weekly markets are known by the names of the villages where they are held and they may be several of them in one commune[26]. On the other hand, markets in urban communes tend to be permanent with names that may or may not be associated with the communes that host them. Also, some urban communes have more than one market located within its perimeters while a few have no market at all. In fact, the large markets in urban centers usually serve the population of several communes and some of them cover a whole department or even the whole region. These extensive urban markets are in general included in the list of 45 markets monitored by the SIM/CSA or in the expanded list of 137 markets compiled by SIM/CSA for the purpose of this protocol.
From the above description we can see that the relationship between communes and markets are multiform with the correspondence between markets and communes not being one-to-one. But, as a working hypothesis for the purpose of this protocol, we can assume that each commune has at least on market while acknowledging that the market attendance level of the majority of them is low. With this working hypothesis, we can take a commune as a market and merge the list of communes with the list of 137 markets compiled by the SIM/CSA. The list of communes we use is provided by SIM/CSA and used by the food distribution unit of the Commissariat a la Security Alimentaire (CSA). The names of many of the markets in the expanded list of 137 markets happened to be the same as the names of the communes hosting them. This fact helped minimize the occurrence of duplicate markets in the merge list. Afterward, we had the SIM/CSA coordinator assign a level of market attendance (high, medium, or low) and a location (rural or urban) to each market/commune that did not match with a market in the SIM/CSA compiled list of markets. Most of the markets/communes that did not match were given a low attendance score with a few of them located in urban centers given a medium attendance score. All of these markets were classified as consumption markets (rural or urban) in accordance with the SIM/CSA categorization of markets. The final merged file contains 583 markets/communes. Comparing this file with the list of communes, there are 31 markets in the original list of 137 markets with names that do not match any name of a commune.
We can now proceed to estimate the market population weight and sample selection probability of every market in this more complete list of 583 markets/communes using the procedure described above. Table 2 gives the summaries by region and market category of the estimated market sample selection probabilities, but based on the more complete list of markets than Table 1 and on the measure of market relative importance based on market attendance level only. Thus, according to Table 2, the largest number of sample clusters (i.e. markets) and traders should be selected from the Dakar region (14%). This is a very sensible result because Dakar has arguably the largest concentration of consumption markets among all the regions. Following Dakar is the region of Louga, the largest cowpea producing region of Senegal, which according to Table 2, should be allocated 9% of the total sample. Louga is followed by two other major cowpea production regions (Diourbel and Thies) and one minor production region (Saint-Louis) with each 8% of the sample. The markets that follow are Fatick, Kaolack, Sedhiou and Tambacounda (with each 7% of the total sample), Kaffrine and Kolda (with 6% each), Matam (5%), Ziguinchor (4%) and Kedougou (3%). This allocation of the market samples and traders among the different regions seem to provide more representative samples of the target populations of markets and traders.
In terms of market categories, Table 2 shows that we expect 68% of the sample markets (and traders) to fall into the rural consumption markets category and 23% into the urban consumption markets category. Hence, the consumption markets will compose 91% of the total sample. With this very large representation of consumption markets in the total sample, we can eliminate the stratification by market type as the study is focused mostly on the retail side of cowpea grain and cowpea-based processed products sold directly to consumers. In other words, we can proceed simply to select a random sample of clusters/markets within each region. Furthermore, to circumvent the problems of i) some communes having more than one market while others having no market (of any importance) and ii) many of the communes/markets in the complete list not being individually identified, for each region we can select the kth most important markets (in terms of market attendance) with k being the region’s allocated sample size of markets. For example, with a total sample size of 100 markets, in Dakar, we would choose the 14 most important markets. Such a sampling procedure is equivalent to a stratified random sampling of traders within each region with markets as sub-strata and with the additional constraint that the sample selection probabilities of traders in markets with attendance levels below some threshold are set to zero.[27]
In contrast to random sampling of markets within a region, this kind of “strata-importance” sampling will ensure that a commune with no market and markets with very low attendance levels will not be selected. Furthermore, it is very likely that the most important markets of each region are already included in the list of 137 markets compiled by SIM/CSA (see above). In fact, for a total sample size of 100 markets, the list contains the markets to be selected under such procedure in all the regions, except Dakar, which has only 8 of its markets in the list (instead of the allocated 14). For Dakar, and for a larger total sample size, the list can be easily completed by the SIM/CSA market monitor agents (or by visiting each region). Thus, the selection of markets under this sampling procedure can be implemented easily without any knowledge of the communes and markets they host.[28]
2.3.3. Recommended sample sizes for markets and grain traders
In cluster random sampling, it is in general more optimal from a statistical point of view to sample more clusters and fewer units within a cluster than the converse (i.e. fewer clusters and more units within cluster). Based on this general guidance, and in the absence of any intra-cluster information (in terms of size and distribution of traders’ characteristics relevant for the study) we propose a minimum of total sample size of 100 markets/clusters of same cluster size across all regions consisting of 2 cowpea grain traders and one non-cowpea grain trader. This gives a minimum sample size of 300 traders.
2.3.4. Recommended sample sizes for the vendors of cowpea-based processed products
As described earlier in section 2.1.2, the vendors of cowpea-based processed products (cowpea flour, “akara” and “ndambe”) are: i) retail traders in local markets, ii) women street food vendors in local markets and in street neighborhoods of urban centers, iii) local restaurant owners, and iv), neighborhood stores and supermarkets (of varying sizes) in urban centers. It will be extremely difficult and costly to urvey all types of cowpea-derived, processed products vendors because of the scattered nature of their locations. For this reason, we propose to survey only i) women street food vendors in local markets and in transport terminals and, ii) restaurants in nearby local markets. [29] With this restriction, the sample of cowpea-based processed products vendors can be selected from the same clusters/markets selected for the sample of grain traders as described above. As in the case of grain traders, we propose a fixed cluster size of 3 vendors of processed food products (including restaurants) with two of them selling cowpea-based processed products. Thus, with the total sample size of 100 markets as proposed above, we will have a sample of 300 vendors of processed food products to survey in addition to the sample of 300 grain traders.
3. References
Cissé, Y (2012). Etude d'Opportunité de Marché Relatif à la Filière Niébé au Mali. Report prepared for the Global Mechanism of the UN Convention to Combat desertification. Unpublished manuscript, Bamako, Mali.
Commissariat à la Sécurité Alimentaire/Système D’information Sur Les Marches Agropastoraux (SIM). 1995. Note Méthodologique de Fonctionnement Du SIM CSA - SENEGAL
Cultivating New Frontiers in Agriculture (CNFA). 2016. Resilience and Economic Growth in the Sahel – Accelerated Growth (REGIS-Project Value Chain and End Market Assessment—Cowpea. USAID Contract #AID-625-C-14-00001.
Dry Grain Pulses Collaborative Research Support Program (2007-2012) and the Feed the Future Innovation Lab for Collaborative Research on Grain Legumes (2013-2017). 2018. Ten-Year Legacy Report 2007-2017. Michigan State University, East Lansing, MI.
Dovlo, F.E., Williams, C.E., Zoaka, L., 1976. Cowpeas: Home Preparation and Use in West Africa. International Development Center, Ottawa, Canada.
Faye, M., A. Jooste, J. Lowenberg-DeBoer and J. Fulton. 2004. The influence of cowpea characteristics on cowpea prices in Senegal. Agrekon 43(4): 418-429
Hollinger, F., and Staatz, J. 2015. Agricultural Growth in West Africa Market and Policy Drivers. FAO, Rome.
Ibro, G., J. Fulton, J., and J. Lowenberg-DeBoer, J. 2006. Factors Affecting Success for Women Entrepreneurs in West Africa: The Case of Kossaï, a Value Added Cowpea Product. Selected paper, American Agricultural Economics Association (AAEA) Selected Paper, Long Beach, California.
Ibro, G., R. Seydou, K. Saley, K. Everhart-Valentin, J. Fulton, J. Lowenberg-DeBoer, and M. Otoo. 2009. Testing the Market Potential for a New Value-Added Cowpea Product to Improve the Well-Being of Women Entrepreneurs in Niger. Journal of International Agriculture Extension and Education, 16(1): 43-56.
Langyintuo, A., J. Lowenberg-DeBoer, M. Faye, D. Lambert, G. Ibro, B. Moussa, A. Kergna, S. Kushwaha and G. Ntoukam. 2003. Cowpea Supply and Demand in West Africa. Field Crops Research 82: 215-231.
Mishili, F.G., J. Fulton, M. Shehu, S. Kushwaha, K. Marfo, M. Jamal, A. Kergna, J. Lowenberg-DeBoer. 2009. Consumer Preferences for Quality Characteristics along the Cowpea Value Chain in Nigeria, Ghana and Mali. Journal of Agribusiness, 25 (1) : 16-35.
Otoo, M. J. Fulton, G. Ibro and J. Lowenberg-DeBoer. 2011. Women Entrepreneurship in West Africa: The Cowpea Street Food Sector in Niger and Ghana. Journal of Developmental Entrepreneurship 16(1):37-63 16-37.
Robinson, E., N. Nwuneli, S. Henson and J. Humphrey. 2014. Mapping value chains for nutrient-dense foods in Nigeria. Institute of Development Studies/Sahel Capital Partners and Advisory, Ltd.
SIM/CSA 2019.
Wade, I. and D. Dia. 2011. Analyse Approfondie de la Filière Niébé. Rapport Provisoire. Projet d’Appui aux Filières Agricoles. Dakar, Senegal.
|
Figure 1: Senegal 2019 cowpea production and area cultivated by region |
|
|
(a) Production
|
(b) Regional shares of production
|
|
(c) Cultivated area
|
(d) Regional shares of cultivated area
|
|
Source: Direction de l'Analyse", "de la Prévision et des Statistiques/Ministère de l'Agriculture et de l'Equipment Rural(DAPS/CSA) |
|
|
Figure 2: Market types and attendance of agricultural product markets in Senegal by region |
|
|
(a) Number of markets by type
|
(b) Percentage of markets by type
|
|
(c) Number of markets by attendance
|
(d) Percentage of markets by attendance
|
|
(e) Market types by attendance
|
|
|
Source: Système d'Information des Marchés/Commissariat à la Sécurité Alimentaire (SIM/CSA) |
|
|
Figure 3: Senegal 2019 cowpea marketing: Market stocks and months of product availability |
|
|
(a) Market stocks by market type
|
(b) Market availability by market type |
|
(c) Market stocks by region
|
(d) Market availability by region
|
|
(e) Stocks by region and market type
|
(f) Market availability by region and market type
|
|
Source: Système d'Information des Marchés/Commissariat à la Sécurité Alimentaire (SIM/CSA) |
|
|
Figure 4: Estimated region strata and within-region strata/cluster market types population weights: |
|
|
(a) region strata weights based on attendance
|
(b) market types weights based on attendance
|
|
(c) region strata weights based on cowpea stocks
|
(d) market types weights based on cowpea stocks
|
|
(e) region strata weights based on cowpea availability
|
(f) market types weights based on cowpea availability |
|
Source: Système d'Information des Marchés/Commissariat à la Sécurité Alimentaire (SIM/CSA) |
|
|
Figure 5: Estimated region strata and within-region strata/cluster market types population weights: |
|
|
(a) region strata weights based on stocks/availability
|
(b) market types weights based on stocks/availability
|
|
(c) region weights based on attendance/stock/availability
|
(d) market types weights based on attendance/stock/availability
|
|
Source: Système d'Information des Marchés/Commissariat à la Sécurité Alimentaire (SIM/CSA) |
|
|
Table 1: Estimated population weights by region strata and cowpea market types based on market cowpea stocks in 2019 (restricted list of 138 markets) |
||||||||||
|
|
|
|||||||||
|
Dakar |
0.00 |
0.00 |
0.05 |
0.03 |
0.08 |
|||||
|
Diourbel |
0.01 |
0.00 |
0.38 |
0.01 |
0.41 |
|||||
|
Fatick |
0.03 |
0.06 |
0.00 |
0.03 |
0.12 |
|||||
|
Kaffrine |
0.00 |
0.00 |
0.00 |
0.01 |
0.01 |
|||||
|
Kaolack |
0.00 |
0.02 |
0.00 |
0.00 |
0.02 |
|||||
|
Kedougou |
0.00 |
0.00 |
0.00 |
0.00 |
0.01 |
|||||
|
Kolda |
0.01 |
0.00 |
0.00 |
0.00 |
0.02 |
|||||
|
Louga |
0.07 |
0.00 |
0.00 |
0.13 |
0.20 |
|||||
|
Matam |
0.00 |
0.01 |
0.00 |
0.00 |
0.01 |
|||||
|
Saint-Louis |
0.00 |
0.02 |
0.00 |
0.02 |
0.04 |
|||||
|
Sedhiou |
0.00 |
0.00 |
0.00 |
0.00 |
0.00 |
|||||
|
Tambacounda |
0.00 |
0.01 |
0.00 |
0.00 |
0.01 |
|||||
|
Thies |
0.04 |
0.00 |
0.00 |
0.02 |
0.06 |
|||||
|
Ziguinchor |
0.00 |
0.00 |
0.00 |
0.02 |
0.02 |
|||||
|
Total |
0.16 |
0.11 |
0.42 |
0.30 |
1.00 |
|||||
|
Source: Authors' computations based on the SIM/CSA data |
||||||||||
|
Table 2: Estimated region strata and cowpea market types population weights based on market attendance |
||||||||||
|
|
|
|||||||||
|
Dakar |
0.00 |
0.00 |
0.01 |
0.13 |
0.14 |
|||||
|
Diourbel |
0.02 |
0.04 |
0.00 |
0.01 |
0.08 |
|||||
|
Fatick |
0.01 |
0.05 |
0.00 |
0.01 |
0.07 |
|||||
|
Kaffrine |
0.00 |
0.04 |
0.00 |
0.02 |
0.06 |
|||||
|
Kaolack |
0.00 |
0.07 |
0.00 |
0.00 |
0.07 |
|||||
|
Kedougou |
0.00 |
0.02 |
0.00 |
0.00 |
0.03 |
|||||
|
Kolda |
0.00 |
0.05 |
0.00 |
0.00 |
0.06 |
|||||
|
Louga |
0.01 |
0.07 |
0.00 |
0.01 |
0.09 |
|||||
|
Matam |
0.00 |
0.05 |
0.00 |
0.01 |
0.05 |
|||||
|
Saint-Louis |
0.00 |
0.07 |
0.00 |
0.01 |
0.08 |
|||||
|
Sedhiou |
0.00 |
0.06 |
0.00 |
0.00 |
0.07 |
|||||
|
Tambacounda |
0.00 |
0.07 |
0.00 |
0.00 |
0.07 |
|||||
|
Thies |
0.03 |
0.04 |
0.00 |
0.01 |
0.08 |
|||||
|
Ziguinchor |
0.00 |
0.03 |
0.00 |
0.01 |
0.04 |
|||||
|
Total |
0.08 |
0.68 |
0.01 |
0.23 |
1.00 |
|||||
|
Source: Authors' computations based on the SIM/CSA data |
||||||||||
Appendix 1: Formula of the market population weights
Let be the value of an absolute measure of importance for market m in region j (m=1,..,Mj and j=1,..,J). Here the generic variable x stands for i) market attendance level (high=3, medium=2 and low=1), ii) the 2019 average of monthly quantities of cowpeas in stock in the market or, iii) number of months where the cowpea product is available in the market during the year 2019. By a combined measure of importance, we mean the a product of two or more individual measures of importance. That is, for a combination of i) and ii) and for a combination of i) ii) and iii).
Further, we define the dummy variables (s=1,…,S), indicator of which category s a market m belongs to (rural assembly market, rural consumption market, wholesale market or urban consumption market) and which takes the value 1 if market m belongs to market category s and 0 otherwise. For ease of reference, we will also define the following sums of market importance values:
= sum of the market importance values of all markets in the country
= sum of the market importance values of all markets in region j
= sum of the market importance values of all markets in market category s
sum of the market importance values of all markets in market category s in region j
With the above definitions and notations, the different market population weights estimated in the protocol are given by the following formula:
= national relative population weight of market m in region j
= national relative population weight of all markets in region j (the contents of the cells of the last column of Tables 1 and 2)
= national relative population weight of all markets in market category s (the contents of the cells of the last row of Tables 1 and 2)
= national relative population weight of all market of region j in market category s (the contents of the cells in Tables 1 and 2, excluding the cells in the last column and last row)
Where, by definition, = (the content of the last cells in Tables 1 and 2, respectively)
Acknowledgement: This work was funded in whole by the United States Agency for International Development (USAID) Bureau for Food Security under Agreement #7200AA18LE00003 as part of Feed the Future Innovation Lab for Legume Systems Research.
[1] The other countries contributing weree by order of importance (Langyintuo et al. 2003): Burkina Faso, Mali, Benin, Ghana, Cameroon, Togo, Senegal, Chad, Cote d’Ivoire and Mauritania.
[2] http://www.fao.org/faostat/en/#data/QC, accessed October 13, 2020
[3] This is in addition to its beneficial effects on soil fertility (nitrogen-fixation) and in crop diversification.
[4] Some urban centers and rural towns are known within the countries (and sometimes outside) for their high concentrations of cowpeas wholesalers (e.g. Louga and Touba in Senegal and the Dawanau Market in Kano in northern Nigeria) (see Mishili et al., 2007; Faye, 2005)
[5] Much of the information in this section come from the SIM/CSA (2019) document and from extensive discussions with Mr. Mouhamadou Ndiaye, the SIM/CSA market analyst and coordinator.
[6] Mr. Mouhamadou Ndiaye, the SIM/CSA market analyst and coordinator, personal communication (see also, (Wade and Dia, 2011; Faye, 2005)
[7] Personal communication from Mouhamadou Ndiaye, SIM/CSA market analyst and coordinator.
[8] Personal communication from Mouhamadou Ndiaye, SIM/CSA market analyst and coordinator.
[9] The main wholesale markets in Dakar are located in its suburbs and they are Tilene, Castor, Thiaroye, Syndicat, Sahm and Rufisque (Personal communication from Mouhamadou Ndiaye, SIM/CSA market analyst and coordinator)
[10] It is important to note at this point that the SIM/CSA classification of a rural market as assembly or consumption market is based primary on the relative importance of the cereal crops (millet/sorghum, maize, rice) and ground nuts in the market in terms of quantity traded and types of traders. These are the most important crops in Senegal in terms of quantities produced and traded.
[11] Personal communication from Mouhamadou Ndiaye, SIM/CSA market analyst and coordinator.
[12] Personal communication from Mouhamadou Ndiaye, SIM/CSA market analyst and coordinator. There is no retail trader specialized in cowpea trading.
[13] Personal communication from Mouhamadou Ndiaye, SIM/CSA market analyst and coordinator.
[14] Both collectors and wholesalers can be found in rural and urban border markets.
[15] The prevalence of retail traders population in each type of market cannot be known in advance because on the prevalence of cowpeas deficits farmers in the region and the consumption habits of the region with respect to cowpeas.
[16] The cowpea floor may or may not be mixed with flour from other cereals or food ingredient in order to increase its nutritional value (e.g. fortified cowpea flour for babies and school children).
[17] The sampling methodology described below is for the selection of cowpea grain traders only. The sample selection for the vendors cowpea based processed products (flour, akra and ndambe) is described below in section 2.3.2. These vendors will be selected, however, in the same markets as the grain traders for reasons explained below.
[18] With probability sampling based on the relative sub-population weights of the three types of traders (if possible and some relevant populations weighs can be calculated).
[19] As explained above, some strata will be empty for some of the regions. Also, at this point of the development of the protocol no border market has been included in the list of markets provided by the SIM/CSA.
[20] Note that as defined above, a collector can also be a retailer but only its collector status will be considered in the stratification. Similarly, a wholesaler can also be a collector as well as a retailer as explained above, but only its wholesaler status will be considered in the stratification. On the other hand, retailers in the pure retailers’ strata operate exclusively as a retailer. Hence, thus defined, the three strata of traders are mutually exclusive.
[21] This assumes that the sample frames of the markets and trader populations are available with the relevant information enabling market category and trader type stratifications (more on this below).
[22] Statistical theory has established that, in general, stratified random sampling is better than simple random sampling, which in turn is better than cluster random sampling with respect to the desired statistical properties.
This supposes that everything else is equal and the sample frames are readily available. Otherwise, one cannot avoid some form of tradeoff.
[23] According to the SIM/CSA coordinator, the SIM/CSA market monitors and supervisors are present in all the 14 regions of Senegal, with a least 2 monitors and one supervisor per region. They collect weekly market prices and quantities traded and stocks data in each monitored market from a sample of traders they follow. In most cases they visit the markets themselves, except when not possible in which case they collect the information through telephone. The SIM/CSA market monitors and supervisors are already helping compile the list of additional markets not covered by the SIM/CSA market monitory system as well as some of the information used to assess the population weight of each markets (including the markets not monitored by SIM/CSA).
[24] In standard survey sampling, the selection probability of a population unit is usually calculated as function of the relative size of the sub-population the unit belongs to.
[25] see Appendix 1 on how the market population weights and sample selection probabilities are calculated
[26] There are 14 958 villages in Senegal
[27] The market attendance threshold level can be determined as a function of a) the total number of markets in the region, b) the sample size of markets allocated to the region and c) the total sample size of markets (i.e. across all regions). The implied post-stratification sampling weight can then be easily calculated and used in the relevant estimation procedures.
[28] The only use of the complete list of 583 communes/markets is for determining the allocated sample size of markets for each region.
[29] The retail traders of agricultural and processed package food products local markets are already covered in the sample of retail traders.


 Print
Print Email
Email