How does margin protection offer coverage?
 Print
Print Email
EmailUnderstanding margin protection payment calculations.
Uncertainty in commodity and input markets continues to be a concern for farm producers. If commodity prices continue to decline faster than input costs, securing positive profits may be an on-going challenge. In an effort to help producers manage profit risks, USDA has expanded coverage in their Margin Protection program.
This article is a continuation of Margin Protection program widens coverage for Michigan field crops. It provides an in-depth look at several aspects of how margin protection provides coverage.
Coverage is based on an expected county-level margin for each applicable crop, type, and practice. Expected margin is calculated as:
Expected Margin = Expected Revenue – Expected Costs
Expected revenue is based on estimated county yields multiplied by a projected commodity price.
To calculate expected costs, two input types are used. Inputs subject to price changes and inputs not subject to price changes. Those inputs not subject to change are considered fixed from planting to harvest. Examples include seed, machinery, and operating costs other than fuel. Inputs that can change based on prices vary depending on crop policy. Inputs that can change by crop are shown in Table 1:
Table 1: Inputs Subject to Price Changes Based on Crop
|
Corn |
Diesel, Urea, Diammonium Phosphate (DAP), Potash, Interest |
|
Soybeans |
Diesel, DAP, Potash, Interest |
|
Rice |
Diesel, Urea, DAP, Potash, Interest |
|
Wheat |
Diesel, Urea, Monoammonium Phosphate (MAP), Potash, Interest |
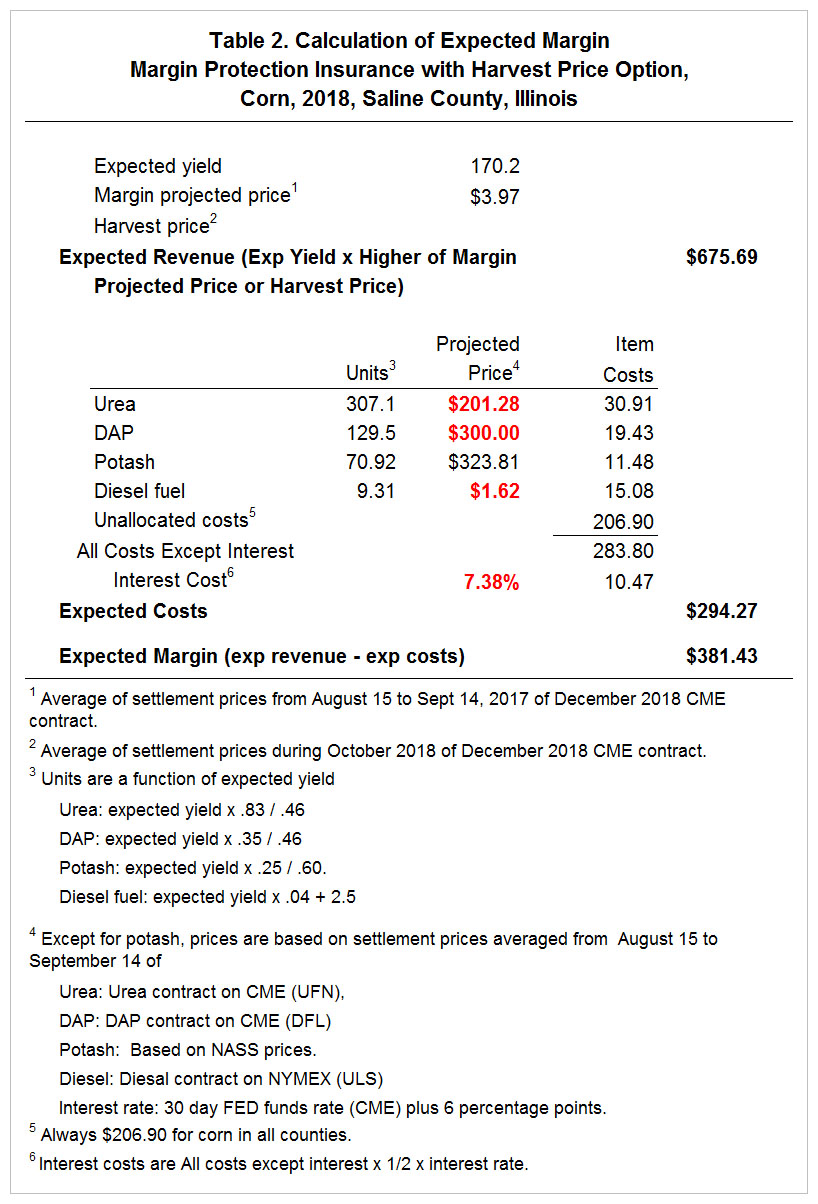
Expected costs are estimated by multiplying each allowed input amount by a projected price (see Figure 1). Note: projected fertilizer prices in Figure 1 are divided by 2,000 and then multiplied by units to equal item costs. Allowed input amounts are heavily influenced by expected yields. Expected yields are set by USDA RMA.
Loss payments are based on comparison of expected margins to trigger margins. A trigger margin is based on expected county-level profit margins multiplied by a selected coverage level (see Table 2).
Table 2: Trigger Margin Example
|
Expected county-level margin |
$373.00 per acre |
|
Coverage level selected |
80% |
|
Deductible (1 – coverage level X expected margin) |
(1 – 0.80) X $373.00 = $74.60 |
|
Trigger margin |
$373.00 – $74.60 = $298.40 per acre |
As Table 2 illustrates, an expected county-level margin is projected at $373/acre. A coverage level of 80% is selected. A deductible is calculated based on a selected coverage level. Deductibles represent the non-covered portion of your protection plan. The deductible is subtracted from an expected county-level margin to arrive at a trigger margin. In Table 2, a trigger margin is calculated at $298.40 per acre.
Once county data has been collected, actual county-level margins will be calculated. If margins are lower than trigger margins, a loss payment will be made (see Table 3).
Table 3: Indemnity (Loss) Example
|
County-level margin |
$225.00 per acre |
|
Trigger margin |
$298.40 |
|
Margin Loss |
$298.40 – $225.00 = $73.40 per acre |
As Table 3 illustrates, actual county level data re-calculates an expected margin to $225/acre. The trigger margin was set at $298.40/acre (see Table 2). The expected margin is lower ($225) than our trigger margin ($298.40), which means a loss payment will be made for the difference. The loss payment is calculated as $298.40 - $225.00 = $73.40 per acre.
Combining margin protection with other insurance policies
What about tradeoffs with other insurance policies? Margin protection can be purchased by itself or with yield or revenue based plans. Yield or revenue plans are based on individual farm coverage. However, yield or revenue loss payments will be subtracted from any loss payment under margin protection (see Table 3).
Table 4: Loss Payment When Combining Margin and Revenue Protection Policies.
|
|
Scenario 1 |
Scenario 2 |
|
Initial Margin Protection Loss Payment |
$100 |
$60 |
|
Revenue Protection Loss Payment |
$70 |
$70 |
|
Final Margin Protection Loss Payment |
$100 – $70 = $30 |
$60 – $70 = less than $0 No Margin Protection Payment |
As Table 4 illustrates, margin protection provides added coverage when combined with other policies. It is meant to duplicate coverage of individual policies. In scenario 1, an initial loss payment from margin protection is higher than revenue protection. The final payment removes duplicate coverage and still nets a positive benefit. In scenario 2, an initial loss payment is entirely offering duplicate coverage and no final margin protection payment would be made. Margin protection cannot reduce payments from other insurance policies.
For producers with existing insurance policies, margin protection may offer added coverage. Potential payments and premiums are important considerations. For producers without insurance, consider similarities between your farm and county information before enrolling. If yields and input prices are similar, margin protection may offer beneficial coverage.
For more information on insurance options, speak with a local crop insurance agent. A list of crop insurance agents is available at USDA’s Agent Locator Website.
This article is based on information supplied by USDA’s Risk Management Agency. For more information, please visit, RMA Fact Sheet on Margin Protection.