


The evolving craft beer market and the raw material supply sector
 Print
Print Email
EmailThe craft beer market and craft beer raw material supply sector continues to evolve.
The craft beer market and craft beer raw material supply sector continues to evolve. Although total beer sales by volume is slowly declining in the U.S. as a result of increased competition with spirits and wine and a decline in overall alcoholic beverage consumption¹, volume of craft beer sales increased in 2017 (Figure 1).
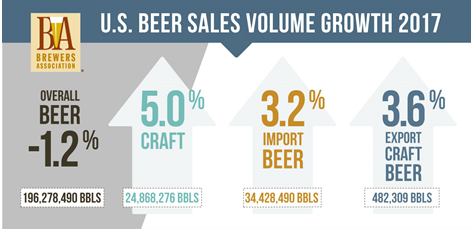
Figure 1. Overall U.S. beer sales by volume, craft, import, and export craft categories. Source: Brewers Association.
In terms of sales volume, craft represents 12.7 percent of total U.S. beer sales, but over 23 percent of sales dollars (Figure 2).
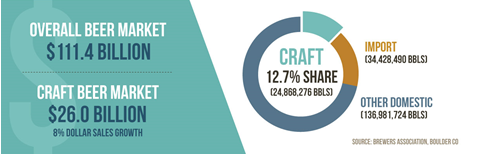
Figure 2. Craft beer as a % of overall sales volume and sales dollars. Source: Brewers Association.
In spite of continued growth, the craft market has matured in recent years. While market growth has slowed, the Brewers Association contends that there will likely be over 7000 U.S. breweries in operation by the end of 2018.
The Great Beer State of Michigan ranks fourth in the U.S. in the number of craft breweries behind CA, WA and CO. Although overall gallons of beer sold in Michigan has consistently declined over the last 30 years, sales of Michigan-made beer has increased. In 2007 Michigan-made beer represented only two percent of beer sold in Michigan. Ten years later it has increased to 10 percent.
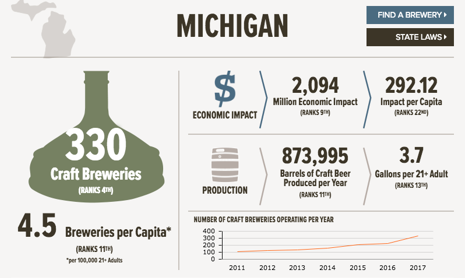
Figure 3. Number of Michigan craft breweries and associated economic impact. Source: Brewers Association.
In 2017, of the 187 million gallons of beer sold in MI, MI brewers sold 18.7 million gallons of beer in Michigan (Bells= 5.9 million gallons; Founders = 3.2 million gallons and Shorts = 1.1 million gallons*). *Note: These figures do not include beer sold outside of Michigan. For more detailed information on Michigan’s beer sector, visit M-LIVE’s recent article, that includes a database tool that allows readers to search amount of beer sold by city, county, or individual business.
As one might expect, the craft beer sector has an effect on agricultural raw materials used in beer. Largely in part to the craft beer revolution, the hop market has changed dramatically over the last ten years. Although craft beer only accounts for 2.5 percent of total beer volume worldwide, it uses 20-25 percent of the total global hop crop. U.S. acreage is up nearly 80% from 2007 with increases each year since 2011. From 2017-2018² overall acreage increased nearly four percent. While there were modest increases in WA and OR, production in Idaho increased nearly 18 percent (from 6993 to 8217 acres). Production outside of the three major growing regions decreased slightly.
Several reports are published annually that may help shed some light on the domestic and international hop market. For example, information on the U.S. hop market can be found by visiting the USA HOPS 2017 statistical report. The International Hop Growers Convention recently released a global market summary and a full report that details production figures from hop producing countries around the globe. Finally, the Barth-Haas Group recently published their 2017/2018 comprehensive annual hop report that offers a thorough analysis of the global hop market.
Save the Date!
Join us in Traverse City Michigan for the 2019 Great Lakes Hop and Barley Conference on March 1-2 at the Park Place Hotel right downtown. This year will include a special focus on nutrient and water management, weed control and pruning and training in hops. If you are interested in sponsorship or vendor opportunities, contact Betsy Braid at braidbet@msu.edu.
Please continue to visit Michigan State University Extension’s hop webpage or the MSU Hops News Facebook site for up to date information.
Citations
¹ https://www.craftbrewingbusiness.com/news/u-s-beverage-alcohol-volumes-decline-again-in-2017-beer-category-declines-substantially/
² https://www.usahops.org/img/blog_pdf/112.pdf
