Check out Enviro-weather’s new features for 2009
Editor’s note: This article is from the archives of the MSU Crop Advisory Team Alerts. Check the label of any pesticide referenced to ensure your use is included.
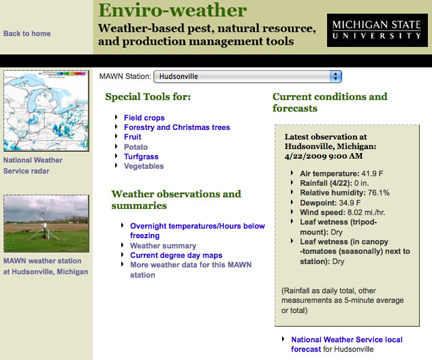
Welcome to a new growing season. After a long, cold winter, it is wonderful to see all the signs of spring. Enviro-weather (www.enviroweather.msu.edu) has been spruced up the for the 2009 season with a new look and new tools. New and existing users can check out these new features by clicking the Enviro-weather link on the left of this page.
New look
The commodity and station pages have been re-organized and re-formatted making them easier to understand and to navigate. The same links, weather summaries, and pest and production models are there; they’ve just been re-arranged and spiffed up a bit.
To access these tools first select your local weather station from the Enviro-weather homepage. The “station page” will be displayed and you can access general weather information and summaries from here.
From the “station page” select “field crops” from the list of commodities to see Enviro-weather tools and links to other tools that are relevant to field crop producers.
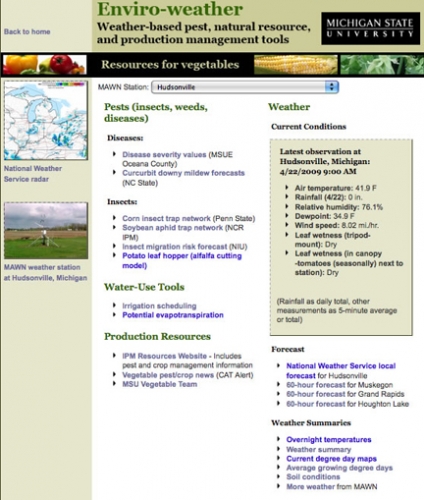
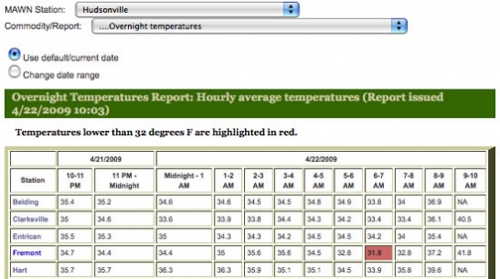
Especially useful this time of year is the “overnight temperatures” tool, which helps growers determine if freezing temperatures have occurred overnight and predicts if they might occur the following night. This tool can be accessed either from the station page or commodity page (listed under “weather summaries).
The overnight temperature tool includes three tables. The average temperature each hour for the previous night (10:00 PM to 10:00 AM) is shown for the selected station and nearby weather stations. Freezing temperatures are highlighted in red.
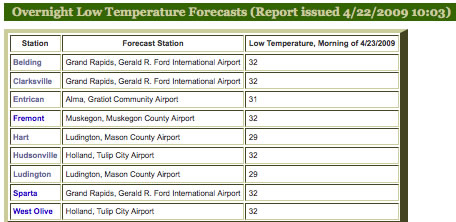
The second table shows predicted low temperatures for following night for the same stations, and the third table shows the late afternoon dew points for the previous day.
New tools
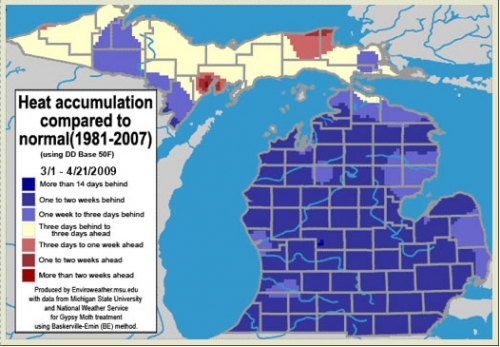
We’ve added a new tool to the station pages and the field crops page. You can check on degree-day accumulation across the state by selecting the “current degree day maps” under the “weather summaries” category at the lower right corner of the vegetable page. The first map displays degree-day accumulations from March 1 to the present date and you can scroll down to see another map depicting departures from normal GDD accumulations.
We hope you find the tools and summaries available through Enviro-weather useful. I welcome any comments, questions, suggestions or ideas you have. I can be contacted at (517) 432-6520 or bishopb@msu.edu.


 Print
Print Email
Email