


Corn nitrogen management assessment using multispectral drone imagery in Michigan
 Print
Print Email
EmailPreliminary studies indicate that the green NDVI was more responsive in differentiating nitrogen rates in corn compared to the red NDVI.
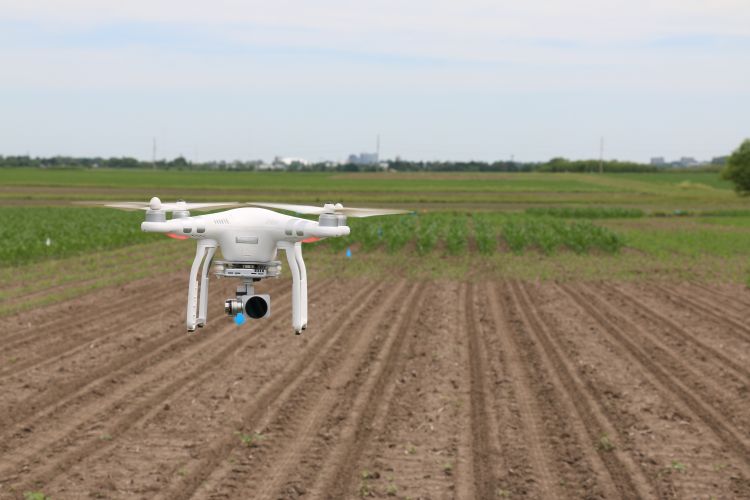
Determining the optimum nitrogen fertilizer rate for corn production is a challenge every year. The unpredictable weather and growing conditions in the Midwest influence both the nitrogen uptake and the nitrogen losses that can alter the optimum nitrogen rate from year to year. In-season diagnostic soil and tissues tests are often time-consuming, expensive and inconsistent. Michigan State University Extension is currently exploring drone-based remote sensing tools for nitrogen management.
There has been a growing interest in using small Unmanned Aerial Vehicles (sUAS), often referred to as drones, as vehicles for carrying sensors for acquisition of remotely sensed imagery. The spatial resolution (pixel size) of imagery acquired from satellites varies from approximately 1.0 meter to 1.0 kilometer, and the resolution of sUAS imagery can vary from 3 millimeters to 2 centimeters. The sUAS imagery is currently optimal for ultra-high spatial resolution imaging acquired over hundreds to a few thousand acres.
As the field of ultra-high-resolution remote sensing has grown, so has the development of new sensing systems designed to be flown on sUAS and single engine piloted aircraft. With these new sensing systems, many questions remain unaddressed, especially the questions related to data quality and its utility. During the process of collecting sUAS imagery, hundreds to thousands of images are acquired over a field. These images are combined to form a composite image called an orthomosaic. There are many outstanding questions about the impacts of the orthomosaic imaging on spectral integrity.
The purpose of our preliminary study was to examine the relationship between corn nitrogen rate and spectral indices, and the relationship between corn yield and spectral indices.
In 2018, corn research plots were established at the Mason Technology Center in Mason, Michigan, with four side-dresses nitrogen (N) rates (0, 60, 120 and 180 pounds per acre). These plots were 20 feet wide and 140 feet long, consisting of eight corn rows spaced 30 inches apart. Nitrogen treatments were replicated four times.
A DJI Matrice 200 drone captured color-infrared (CIR) imagery over the plots at corn growth stages V10 and V12, using a Zenmuse X4S camera converted to sense red, green and near-infrared (NIR) wavelengths. The aerial images were uploaded and Pix4D was used to derive orthomosaics. The orthomosaics were normalized for bidirectional reflectance distribution function anomalies and an improved dark object subtraction method by Chavez, 1988, was used to normalize the imagery for atmospheric scatter.
In this article, we discuss the preliminary results of the spectral data collected at the V12 corn growth stage and how it was related to nitrogen rate and grain yield. We extracted plot-level pixel spectral digital numbers from four samples in each plot (a total of 16 digital numbers samples for each nitrogen treatment). The spectral data was collected over a rectangular area directly above the row canopy. This method reduced the reflectance effects from bare soil surfaces and shaded areas.
The digital numbers ranged from 0 – 255 and the ratio values for the vegetation indices were rescaled to values from 0 – 255 to avoid working with fractions and negative numbers. The digital numbers were used to calculate the corresponding green and red normalized difference vegetation index (NDVI) for each nitrogen treatment. Low index values generally indicate a lower plant biomass and higher numbers indicate a higher plant biomass.
The yield response to nitrogen rate is shown in Figure 1.
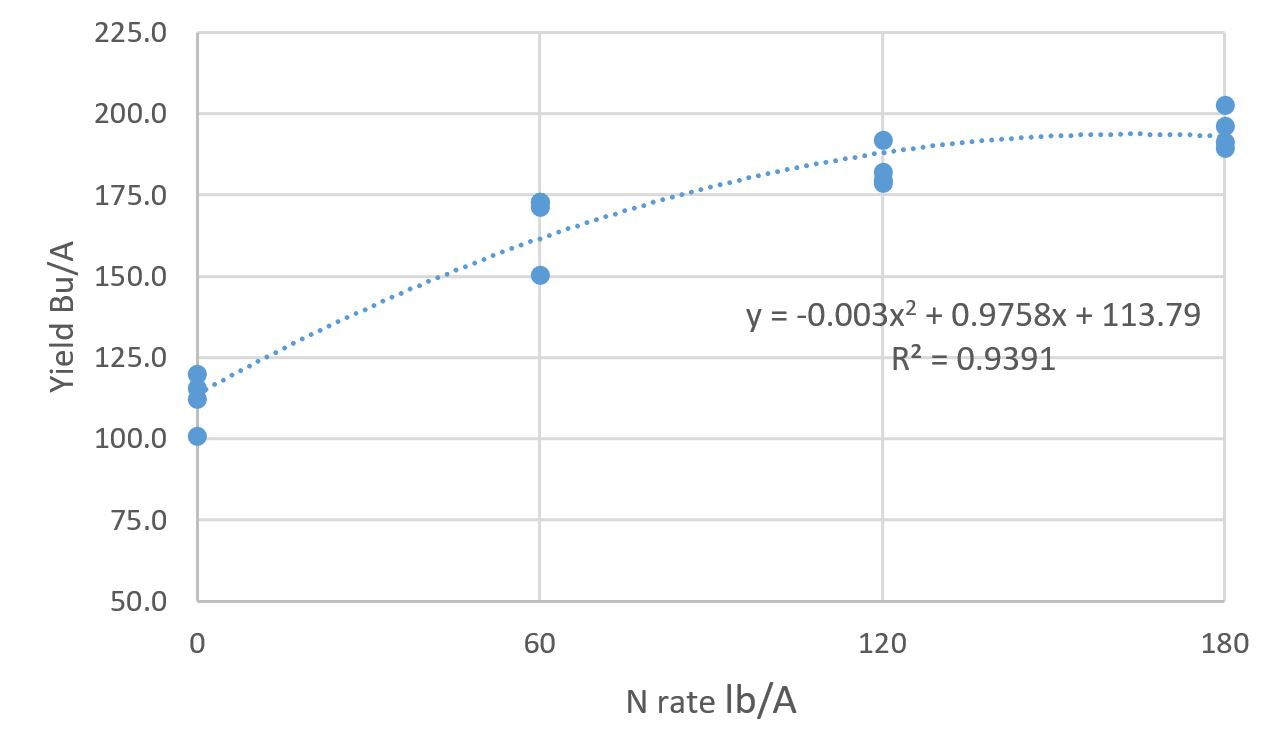 Figure 1. Crop yield versus nitrogen rate.
The vegetation indices corresponding to nitrogen rate are shown in Table 1. There were statistical differences among the green NDVI values, but not the red NDVI values. The green NDVI was much more responsive in differentiating nitrogen rates. It was better correlated with crop yield compared to red NDVI (Figs. 2 and 3).
|
Table 1. Green NDVI and Red NDVI |
|||
|---|---|---|---|
|
Nitrogen rate (pounds per acre) |
Yield (bushels per acre) |
Green NDVI |
Red NDVI |
|
0 |
112 d |
136.9 c |
114.0 |
|
60 |
167 c |
155.5 b |
113.9 |
|
120 |
183 b |
158.9 ab |
117.6 |
|
180 |
196 a |
167.9 a |
117.5 |
|
|
LSD = 11.5 |
LSD =11.2 |
NS |
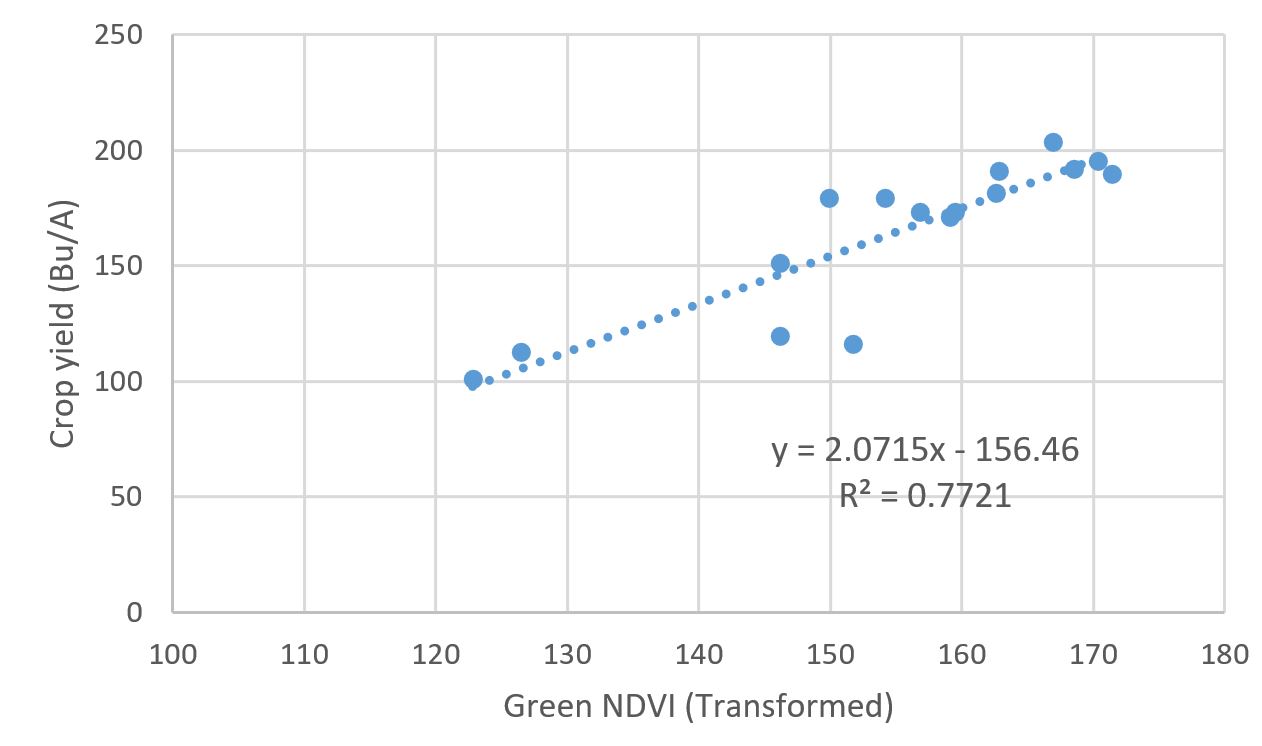 Figure 2. Crop yield versus green NDVI.
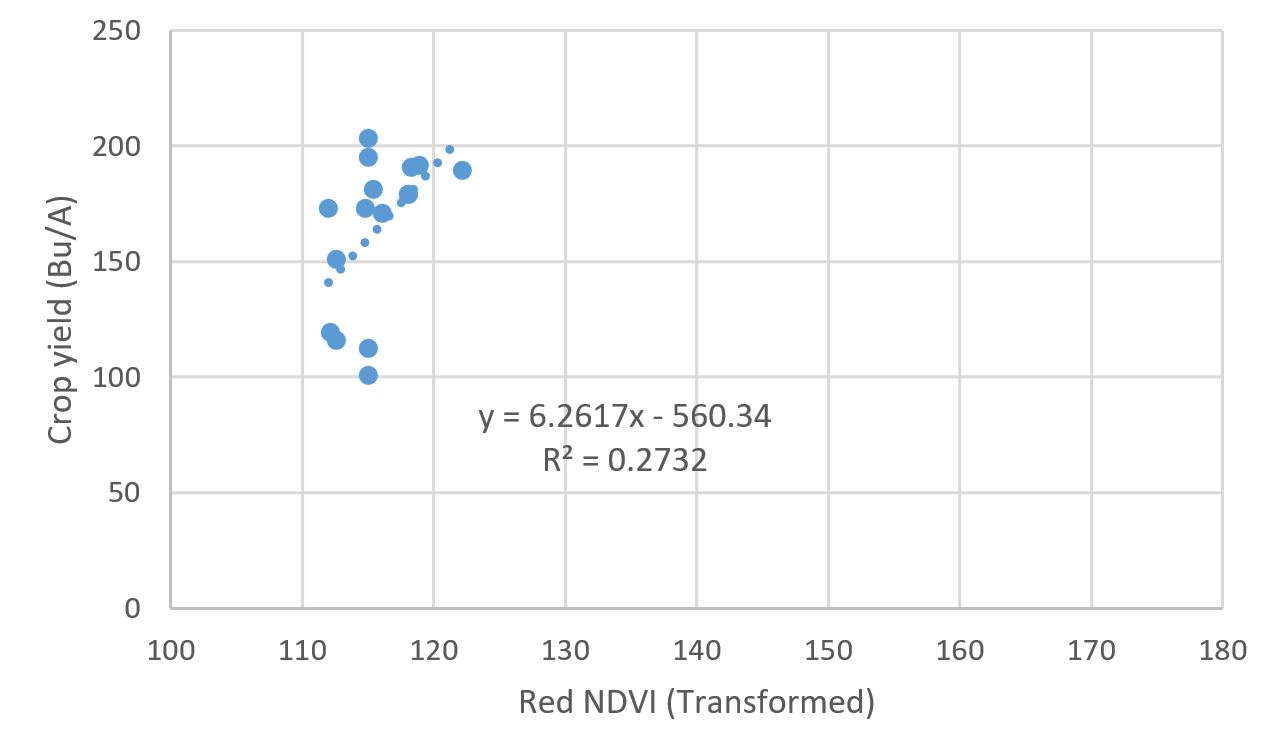 Figure 3. Crop yield versus red NDVI.
These findings are supported by those reported by Gitelson et al., 1996, and others where the green wavelengths were more sensitive to changes in plant pigmentation. Spectrometer measurements of three soybean leaves at different maturity stages (Fig. 4) also shows that the greatest spectral variation among the leaves is in the green and yellow regions of the electromagnetic spectrum. Notice that the optimal region of the spectrum for spectrally discriminations among the three leaves is in the green region between 500 and 600 nm. Notice too that the youngest and middle-aged leaves are spectrally similar in the red region, especially around 680 to 730 nm. The peak region for chlorophyll absorption is 680 nm, which is why the spectral values are so low in this region.
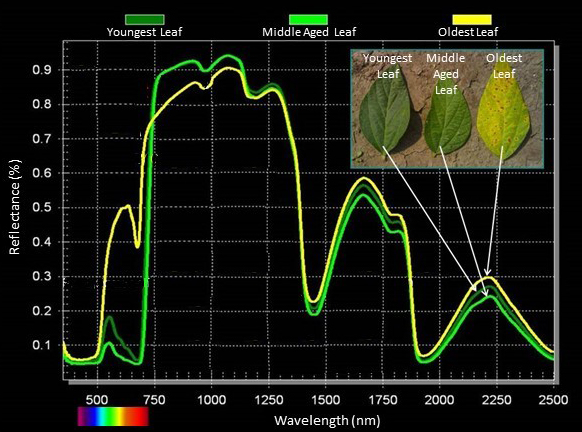 Figure 4. Spectral response curves for three soybean leaves at different stages of growth maturity.
In the coming years, additional sUAS images need to be taken to assess the year-to-year robustness of the nitrogen and yield correlations with the green NDVI and red NDVI. The red-edge index will also be investigated. Different camera options will need to be tested including those that have separate lenses for different bands of light. Using non-limiting nitrogen rates as nitrogen reference plots and combining multiple years of data, we intend to establish yield related nitrogen sufficiency indices, like those that have been established for hand-held chlorophyll meters. The goal would then be to compute NDVI based algorithms to aid in detecting nitrogen deficiency situations. The sufficiency indices models could also be utilized to predict the amount of in-season nitrogen needed as rescue applications.
I would like to acknowledge Ray David, Remote Sensing Technologies LLC, for operating drone flights and capturing images. Special thanks go to Kevin Price, TMI Solutions LLC, for data processing, orthomosaic maps and interpretation. Also, the excellent collaboration of Bayer crop scientists Steven Gower and Tim Dietz is kindly appreciated.
Additional information about this project are in these previous MSU Extension articles:
