Corn stalk nitrate results in southwest Michigan fields in 2016
 Print
Print Email
EmailTest stalk nitrate levels at the end of the season to measure the adequacy of nitrogen fertility in corn.
Farmers want to make sure their fertilization program does not “leave yield in the field,” and one way to measure the adequacy of nitrogen (N) fertility in a corn crop is by testing stalk nitrate levels at the end of the season. Corn plants that are N stressed during grain fill will translocate nitrate from the lower stalk to the kernels, thus resulting in relatively low stalk nitrate concentrations. Research at Purdue University, Penn State University and Iowa State University has shown that end-of-season stalk nitrate levels from 700 (450 according to Purdue University) to 2,000 parts per million (ppm) correspond to an optimum amount of N available to the corn plant during the season (Table 1).
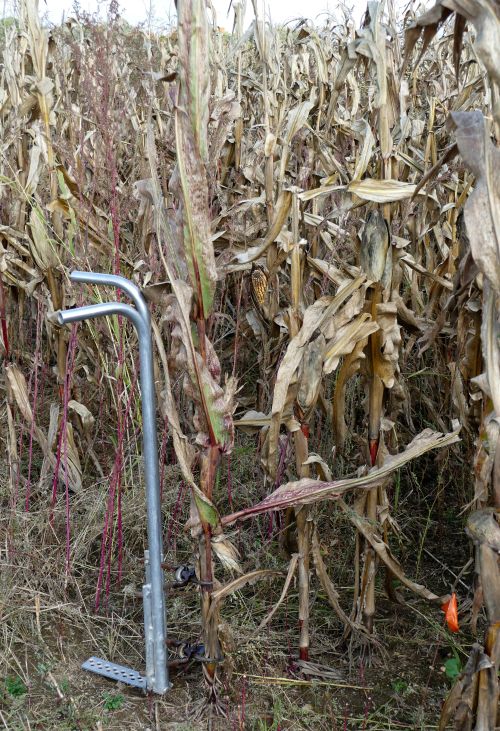
Several fields in southwest Michigan were sampled this fall for stalk nitrate-N. Samples were taken according to the protocol outlined in the Michigan State University Extension tip sheet, “End of Season Cornstalk Nitrate Test,” using a designated cutting device (see photo) that uniformly took 8-inch stalk samples at 6 inches from the soil level. Samples were taken from fields with varying production management systems and growing conditions (Table 2). Four consecutive stalks in a row where no planting spatial variability was observed were sampled at four locations in each field for a total of 16 samples per field. Stalk samples were sent to the MSU Soil and Plant Nutrient Laboratory for analysis.
Four of the 21 samples tested low for stalk nitrate-N, seven were marginal or optimal, and the remainder were high with three fields showing very high levels (Table 2). Repeated measurements over several years from these fields and more thorough collection of data regarding rainfall/irrigation, historic yields from each field, current yields from surrounding fields and field fertility history would allow for an in-depth analysis of these data. However, a few results are worth noting.
The fields labeled “A_” were fertilized with 7,800 pounds per acre of poultry litter with presumably 55 pounds per ton N available the first season. This field was irrigated and regional temperatures were higher than normal, and it is possible more than that amount of N was made available this season through mineralization. Fields with Sebewa soils (H-M) may have had higher test levels due to those soils tending to have higher soil organic matter, and thus more potential mineralizable N.
The field labeled P had cattle manure applied at least annually for several years prior to this season, which likely explains why stalk nitrate-N tested so high there. It is interesting to note those fields that were sampled twice (e.g., E1 and E2) had stalk nitrate levels that were fairly close, which suggests variability within the field did not greatly affect the analyses.
MSU Extension recommends farmers perform stalk nitrate tests over multiple years since results from a single season can be affected by multiple factors—previous crop, soil temperatures the previous fall and spring, past fertility practices, weed pressure, precipitation amount and timing, hybrid, etc. Ideally, test strips should be placed in each field with differing levels of N fertility for each hybrid to allow for a meaningful comparison of yields and stalk nitrate levels and, therefore, give the farmer a better sense of what N level is optimum for that given field on average. “Dialing in” the optimum N fertility program may increase profits by reducing fertilizer costs and increasing yields, and it will help ensure farmers “keep it for the crop” rather than losing N to the environment.
|
Table 1. Interpretation of the end-of-season stalk nitrate-N test (units in parts per million, ppm). | ||
|---|---|---|
|
Excessive |
Greater than 2,000 |
Excessive N available to the crop, or some other production factor limited crop growth and yield |
|
Optimum |
450 to 2,000 (Purdue) |
Grain yield was not limited by amount of N available to the crop |
|
Marginal |
250 to 700 (ISU & PSU) |
Nitrogen supply may have limited yield |
|
Low |
Less than 450 (Purdue) |
N was likely yield limiting during the growing season, especially < 250 |
Table from “Corn stalk nitrate test and N management” by Darryl Warncke, MSU Extension.
|
Table 2. Field data and lab analyses. | ||||
|---|---|---|---|---|
|
Seeding rate (1,000 seeds/acre) |
Nitrate-N (ppm) | |||
|
A1 |
Oshtemo |
215 |
32 |
2,915 |
|
A2 |
Oshtemo |
215 |
32 |
2,217 |
|
A3 |
Oshtemo |
215 |
32 |
879 |
|
A4 |
Oshtemo |
215 |
32 |
4,857 |
|
B |
Kalamazoo |
30+66 |
22-28 |
321 |
|
C |
Kalamazoo |
30+100 |
22-32 |
2,330 |
|
D |
Oshtemo |
30+100 |
18-28 |
9 |
|
E1 |
Kalamazoo |
30+100 |
22-33 |
731 |
|
E2 |
Kalamazoo |
30+100 |
22-33 |
634 |
|
F1 |
Kalamazoo |
30+100 |
20-30 |
187 |
|
F2 |
Kalamazoo |
30+100 |
20-30 |
89 |
|
G1 |
Kalamazoo |
30+100 |
22-30 |
871 |
|
G2 |
Kalamazoo |
30+100 |
22-30 |
530 |
|
H |
Locke, Sebewa |
28+190 |
32.5 |
2,900 |
|
J |
Sebewa |
27+160 |
32.5 |
2,442 |
|
K |
Sebewa |
27+150 |
32.5 |
2,608 |
|
L |
Sebewa |
27+128 |
32.5 |
5,876 |
|
M |
Locke, Sebewa |
28+160 |
32.5 |
2,960 |
|
N |
Spinks, Oshtemo |
30+78 |
29 |
295 |
|
O |
Oshtemo, Oshtemo-Ockley complex |
30+118 |
30 |
112 |
|
P |
Oshtemo-Ockley complex |
30+128 |
32 |
7,353 |
a Letters followed by numbers represent multiple replications from a single treatment in a field.
b Oshtemo: sandy loam; Kalamazoo: loam; Locke: fine, sandy loam; Sebewa: loam; Spinks: loamy, fine sand; Ockley: silt loam.
c Total nitrogen applied includes at planting plus sidedress when applicable.