Fall and winter drought could cause challenges in crops
Below normal precipitation during the fall and winter has resulted in a decline in groundwater levels. Producers need to prepare for potential challenges, especially if they irrigate crops.

Living in the heavily irrigated Michiana area (Michiana is the area of northern Indiana and southwest Michigan that is home to over three-fourths of the irrigation in both states.), we often think of drought as only a summer issue when nature fails to provide the normal 15 to 17 inches of rainfall during the May-August cropping season that keeps our irrigation use relatively low. However, fall and winter deficits in precipitation still result in both positive and negative issues for area irrigators.
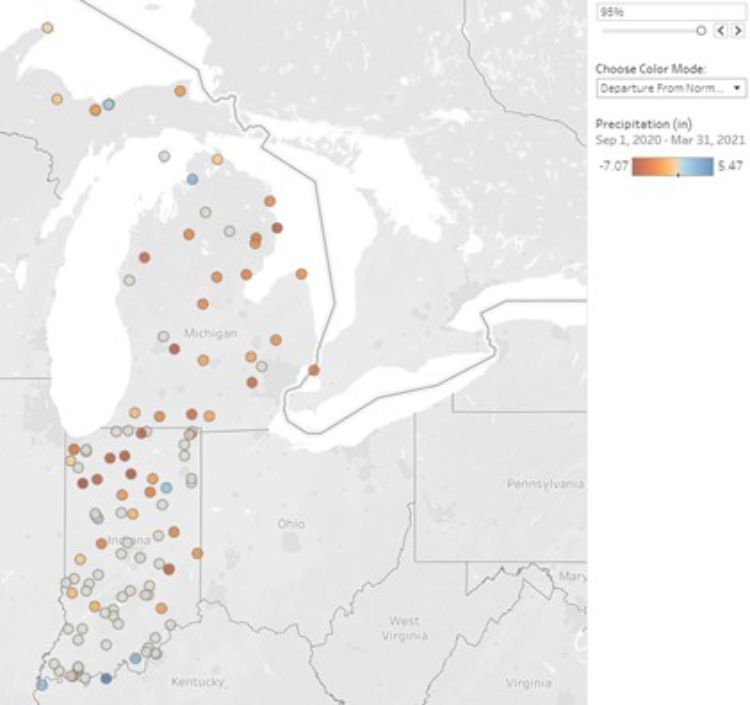
In some areas, the lack of rainfall started in August but most of southwest Michigan and northwest Indiana have had significantly less rainfall then normal from September 2020 through early April 2021. A diagonal strip of weather stations from Rensselaer, Indiana, to Saginaw Bay, Michigan, all report 5-8 inches in deficit precipitation from normal over the seven-month period.
Purdue University’s Indiana State Climate Office created a graphic and tool that depicts the dryness from September through March. The darkest brown dots depict 5-8 inches in deficit precipitation from normal.

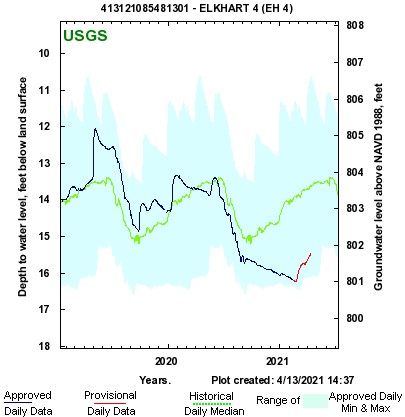
Todd Feenstra of Tritium Inc., an Elkhart-based hydrology firm, who has studied groundwater fluctuation in Michigan and Indiana for over two decades, points out that it is still in the normal range. Long-term groundwater level monitoring over the past decade in southwest Michigan has shown that groundwater levels naturally rise and fall between 1 foot and 3 feet each year. The low water levels tend to occur in the late summer or early fall and correspond with the end of the growing season. The highest levels are typically observed sometime in the early spring just after the frost leaves the ground.
The water levels in the monitoring wells this spring seem to have returned to what should be considered normal, healthy levels after two years of very high water levels in 2019 and 2020. We highly recommend knowing where the groundwater levels are in your area prior to the start of the irrigation season. Expect to hear concerns about falling water levels this year, and be prepared to talk knowledgeably about precipitation, natural fluctuations, and pumping impacts, says Feenstra.
In the arid western U.S., precipitation during the non-crop season is needed to help refill the soil profile. It is a common practice in the wheat-growing regions of Kansas to fallow for a year to accumulate rainfall over two years to raise a crop. In Michiana’s wetter climate, average rainfall refills the soil profile normally by mid-October, allowing the remainder of winter and spring precipitation to refill the aquifer below.
There are some benefits of the static water level being well below the median over the winter. The wetter than average weather from 2014-2019 created major challenges for many producers, resulting in a demand for tile drainage in areas where it had not been common before. The drier spring soil condition of 2021 and lower water table have allowed producers to start tillage work in many fields by mid-March that may not have been able to be worked until early June in some prior years.

David Smith of the Indiana Department of Natural Resources Division of Water had this to say on the current drought situation, “Northern Indiana and Southern Michigan continue to experience drier than usual moisture conditions. Since Jan. 1, 2021, total precipitation across the Michiana region averaged 4-6 inches below normal. The current deficits are in contrast to conditions in March 2020 when the region averaged 2 inches above normal. That is a 7-inch swing in the amount of water received compared to last year. The current drier than usual conditions are evident by observed below-normal lake and stream levels which are major contributors to groundwater.
“Accounting for the combined precipitation, stream flow, lake level and groundwater anomalies, the U.S. Drought Monitor has identified portions of the region in moderate drought. As temperatures increase and trees break dormancy, the rate of water loss to the atmosphere will increase, placing further demand on already seasonally limited water resources. So how bad is it? Using statistical comparison, the level of drought across the region at this time of year (<-2 on Palmer Drought Severity Index) has only been recorded seven times since 1950, the most recent year being 2007,” said Smith.
Graphs of the observed depth to water table for the northern Indiana monitoring well from 2008 to the present are available at: Indiana Active Water Level Network.
With the last few years of record high groundwater levels followed by the unseasonal decline this winter, it behooves irrigators to document water levels before the irrigation season starts. A dated photo of surface water levels before the irrigation season starts or a static water level test conducted by a well driller or hydrologist can be important pieces of data if there is local conflict over irrigation water use later in the summer. Descriptions and instructions for measuring well water levels can be found in the document “Measuring Water Levels in Wells” from the Indiana Department of Environmental Management.
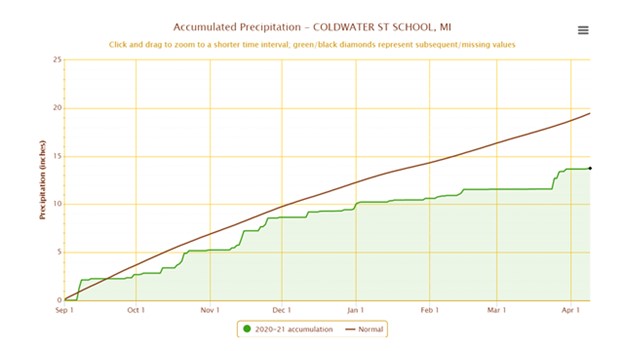
Michigan State University’s Enviroweather program has many tools to help producers monitor and manage their response to weather and weather related events. Below is a graphic from Enviroweather depicting fall and winter rainfall compared to normal at the Coldwater station. The graph of your local rainfall compared to normal can be found at the Enviroweather website.

Special thanks to Jeff Andresen, MSU Extension environmental quality specialist, Mark Basch and David Smith of Indiana DNR-Division of Water, and Todd Feenstra, Tritium Inc. for their contributions to this article.


 Print
Print Email
Email

