How much does it cost you to produce milk? Part 1: 2011 cost of production in Michigan
Michigan Dairy Farm Business Analysis Summary data show that the cost to produce milk in Michigan increased by over 17 percent from 2010 to 2011.
An analysis of the most recent “Michigan Dairy Farm Business Analysis Summary” shows that the average cost of producing milk in Michigan rose over 17 percent from 2010 to 2011. Each year Michigan State University Extension and the Michigan State University Department of Agricultural, Food, and Resource Economics collects financial data from over 100 Michigan dairy farms. This information has been collected, pooled, analyzed, summarized and published each year since 1995. The most recent data (2011) was published in October, 2012. The data is analyzed and summarized by profitability into three categories based on return on assets (low 25 percent, average, and high 25 percent) and by herd size.
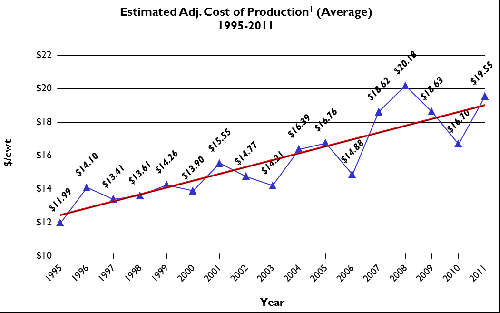
The cost of milk production from that data set was also adjusted for the cost of producing other “non-milk” items on the farm and for depreciation and inventory changes. Figure 1 shows the estimated and adjusted cost of milk production in 2010 was $16.70/cwt. and rose 17.1 percent in 2011 to $19.55/cwt. 2011 saw a slight decrease in milk sold per cow (-105 lbs./cow/year). However, despite higher milk production costs, return on assets in 2011 outpaced 2010 by 4.2 percentage points (2010, 7.0 percent vs. 2011, 11.2 percent) as milk price received rose 23.1 percent in 2011 ($20.65/cwt.) as compared to 2010 ($16.78/cwt.).

Figure 1: Estimated adjusted cost of milk production in Michigan, 1995-2011. (Estimated Adj. Cost of Production equals Estimated Cash Cost of Production adjusted for total depreciation and total inventory changes.)
Analysis of cost data showed the largest increases were in purchased feed and principal payments. From 2010 to 2011 purchased feed increased 27.5 percent (2010, $5.27/cwt. vs. 2011, $6.72/cwt.) and principal repayments increased 27.6 percent (2010, $3.04/cwt. vs. 2011, $3.88/cwt.). Explaining the increase in purchased feed costs is relatively straightforward. Using USDA data as a proxy for purchased feed expense indicates the average price for a 16 percent crude protein mixed dairy feed (51 lbs. of corn, 8 lbs. of soybeans, and 41 lbs. of alfalfa hay) rose almost 50 percent from 2010 to 2011 (2010, $7.21/cwt. of feed vs. 2011, $10.76/cwt. of feed) due to large increases in average prices for corn (+57.2 percent) and alfalfa hay (+51.2 percent), and somewhat for soybeans (+25.7 percent).
The increase in principal payments is most likely related to extra principal being repaid due to greater profitability in 2011. The data support this conclusion since gross cash margin rose 550 percent from 2010 to 2011 (2010, $0.28/cwt. vs. 2011, $1.82/cwt.). Also, the amount of money borrowed per cow in 2011 was 49.0 percent higher than in 2010 (2010, $661/cow vs. 2011, $985/cow) yet total farm debt in 2011 fell 5.3 percent versus 2010 (2010, $3,990/cow vs. 2011, $3,777/cow). Debt per cow reached its peak in the terrible year of 2009 (average mailbox milk price of only $13.11/cwt.) with total money borrowed for that year at $1,398/cow and total farm debt at $4,223/cow. Thus, it appears many Michigan dairy producers started to chip away at their accumulated debt due to favorable milk prices in 2011.


 Print
Print Email
Email


