Mapping Michigan’s lake habitats
 Print
Print Email
EmailAdd Summary
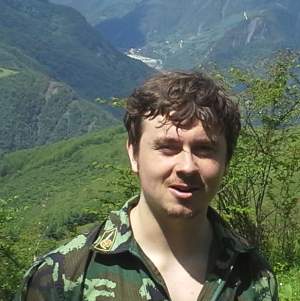
Joe Nohner is a CSIS PhD student who's studying largemouth bass, specifically how habitat helps baby largemouth survive and grow, and the socioeconomic factors that influence landowners’ habitat management choices. He's also a passionate fisherman who aims to understand the layers and layers of complexity to solve ecosystem problems. This is an excerpt from Joe's blog, Fishing for Habitat.
Jan. 8, 2015
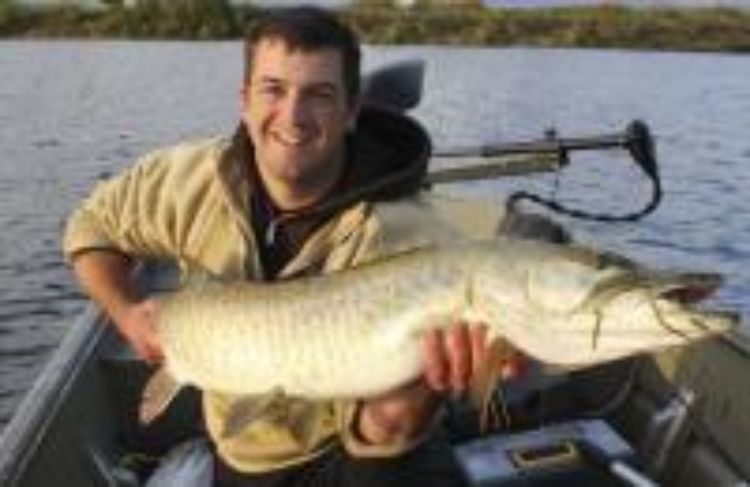
Our main hypotheses are that habitats affect the distribution, abundance, diets, and growth rates of Largemouth Bass. How do we get this habitat data? In previous posts I’ve discussed how we catch fish and collect their gut contents, so this article will focus on our vegetation mapping.
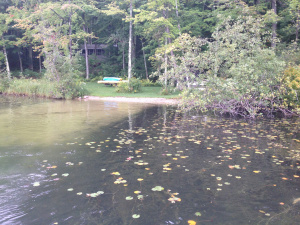 We mapped patches of vegetation in lakes, such as these lily pads near a developed shoreline with its vegetation cleared (see photo at right).
Vegetation mapping techniques have advanced rapidly in the past decade with new technologies allowing us to do things that we never thought possible. Some of the first aquatic vegetation maps in Michigan were produced in the 1930s and 1940s, but required careful surveying and were limited in resolution. Computer programs now enable digital mapping, which in turn makes research such as ours possible. In a perfect world, we would simply use aerial or satellite photos taken around the same time as our surveys. These techniques have been used with some success on the Great Lakes, but their application to small inland lakes can be hampered by water clarity, tree canopy cover, and expense. The NASA option out, the next best plan was to visually map each lake in the field.Over the course of about three weeks in September, our team mapped the vegetation, docks, and woody habitats in 16 Michigan lakes using a handheld GPS. The plan was simple: drive around the edge of each vegetation patch logging GPS points to create the border, and then add the habitat information about each patch.
Check out the video below of Mitch Nisbet and me mapping a patch of lily pads on Chief Lake.
We mapped all of the patches in depths of five feet or shallower. Polarized sunglasses meant that I was able to see through the water while steering the boat along the edge. The person with the GPS logged a series of waypoints, and I dictated the type, percent coverage, and average height of the vegetation for each patch. 2,800 patches later we were done.
After finishing mapping in the field we had a set of borders, but we still needed to put the finishing touches on our maps. Back in the office, we turned the borders into complete patches and made sure that all of the edges lined up nicely. Then, we overlaid maps of where we caught fish with the maps of the habitat. We’ll use this information along with length, weight, and diet data from the fish to look for associations.
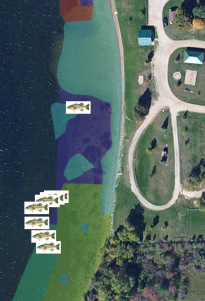 The final product of our mapping (photo at left) shows patches of similar vegetation, which we can compare to the locations of fish captured during our surveys.