


Northwest Michigan midseason vineyard update
 Print
Print Email
EmailWe had a slow start to the season, with tepid temperatures and prolific precipitation.
This season, wine grape producers in the Leelanau Peninsula and Old Mission Peninsula AVAs (American Viticultural Areas) are dealing with a combination of environmental factors that further limit the already narrow window for fruit ripening in Michigan’s short and highly variable growing season. In these AVAs, bud break typically occurs near May 15. However, the lower than normal heat unit accumulation (growing degree days, GDD) during the month of May likely played a major role in the delay of bud break by roughly seven to 10 days, up to 10-14 days on cooler sites (Table 1). In fact, May 2019 was the coolest in the past five years, and well below the five-year average (Table 1).
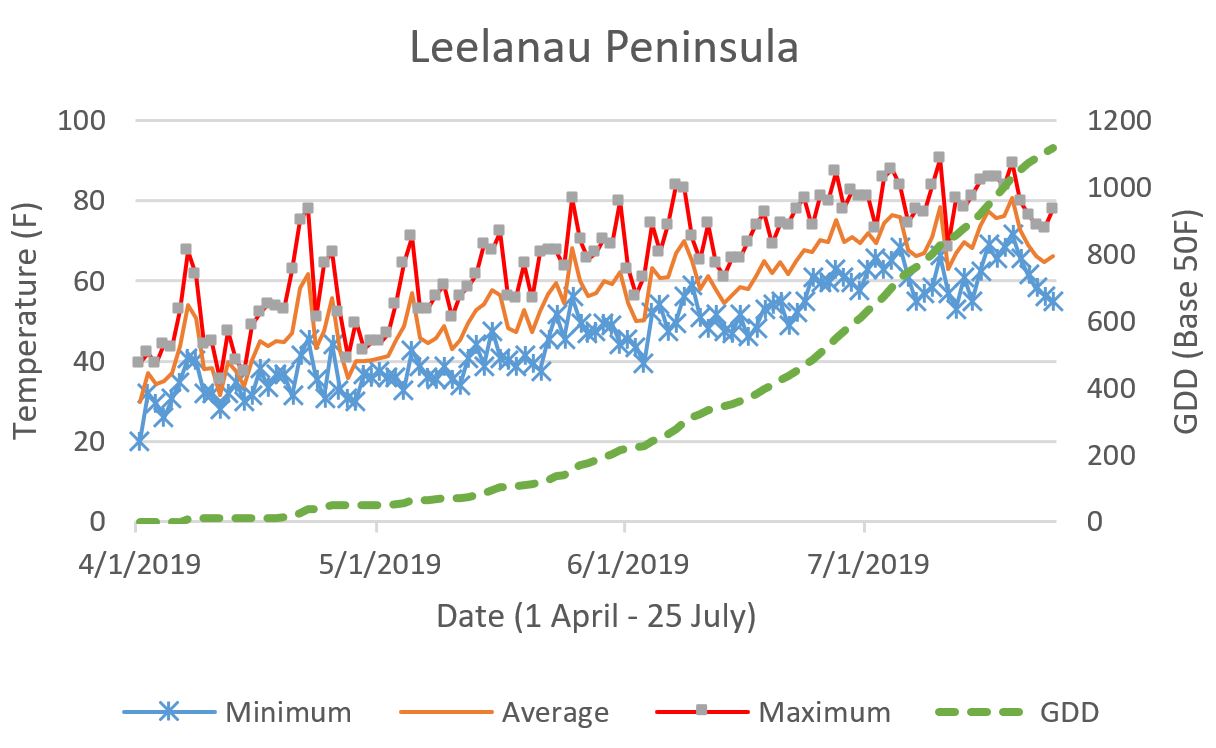
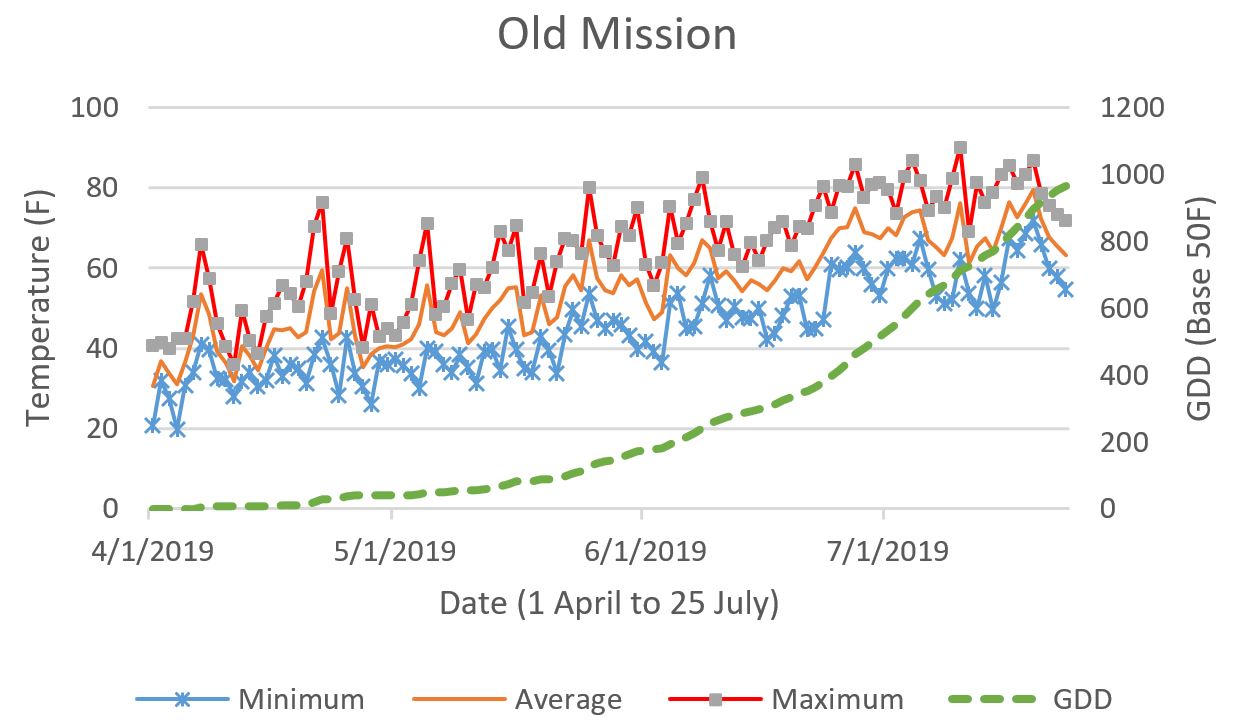
The “cool trend” does not stop there. This year, Leelanau Peninsula (1,052 GDD) and Old Mission Peninsula (957 GDD) have accrued the fewest recorded heat units than in any year during the past five years and are well below their respective five-year GDD average of 1,227 and 1,152 (Tables 2, 3 and Figs. 1, 2). This year is also different than the past five years with much greater amount and time of rainfall in Leelanau with 13.52 inches and 231 hours, and Old Mission with 14.02 inches and 237 hours (Tables 2, 3).
Phenology, fruit quality and crop control
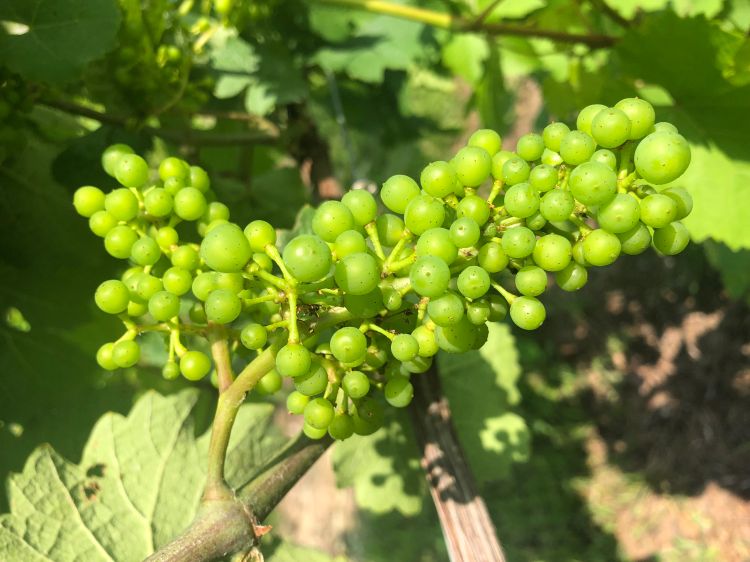
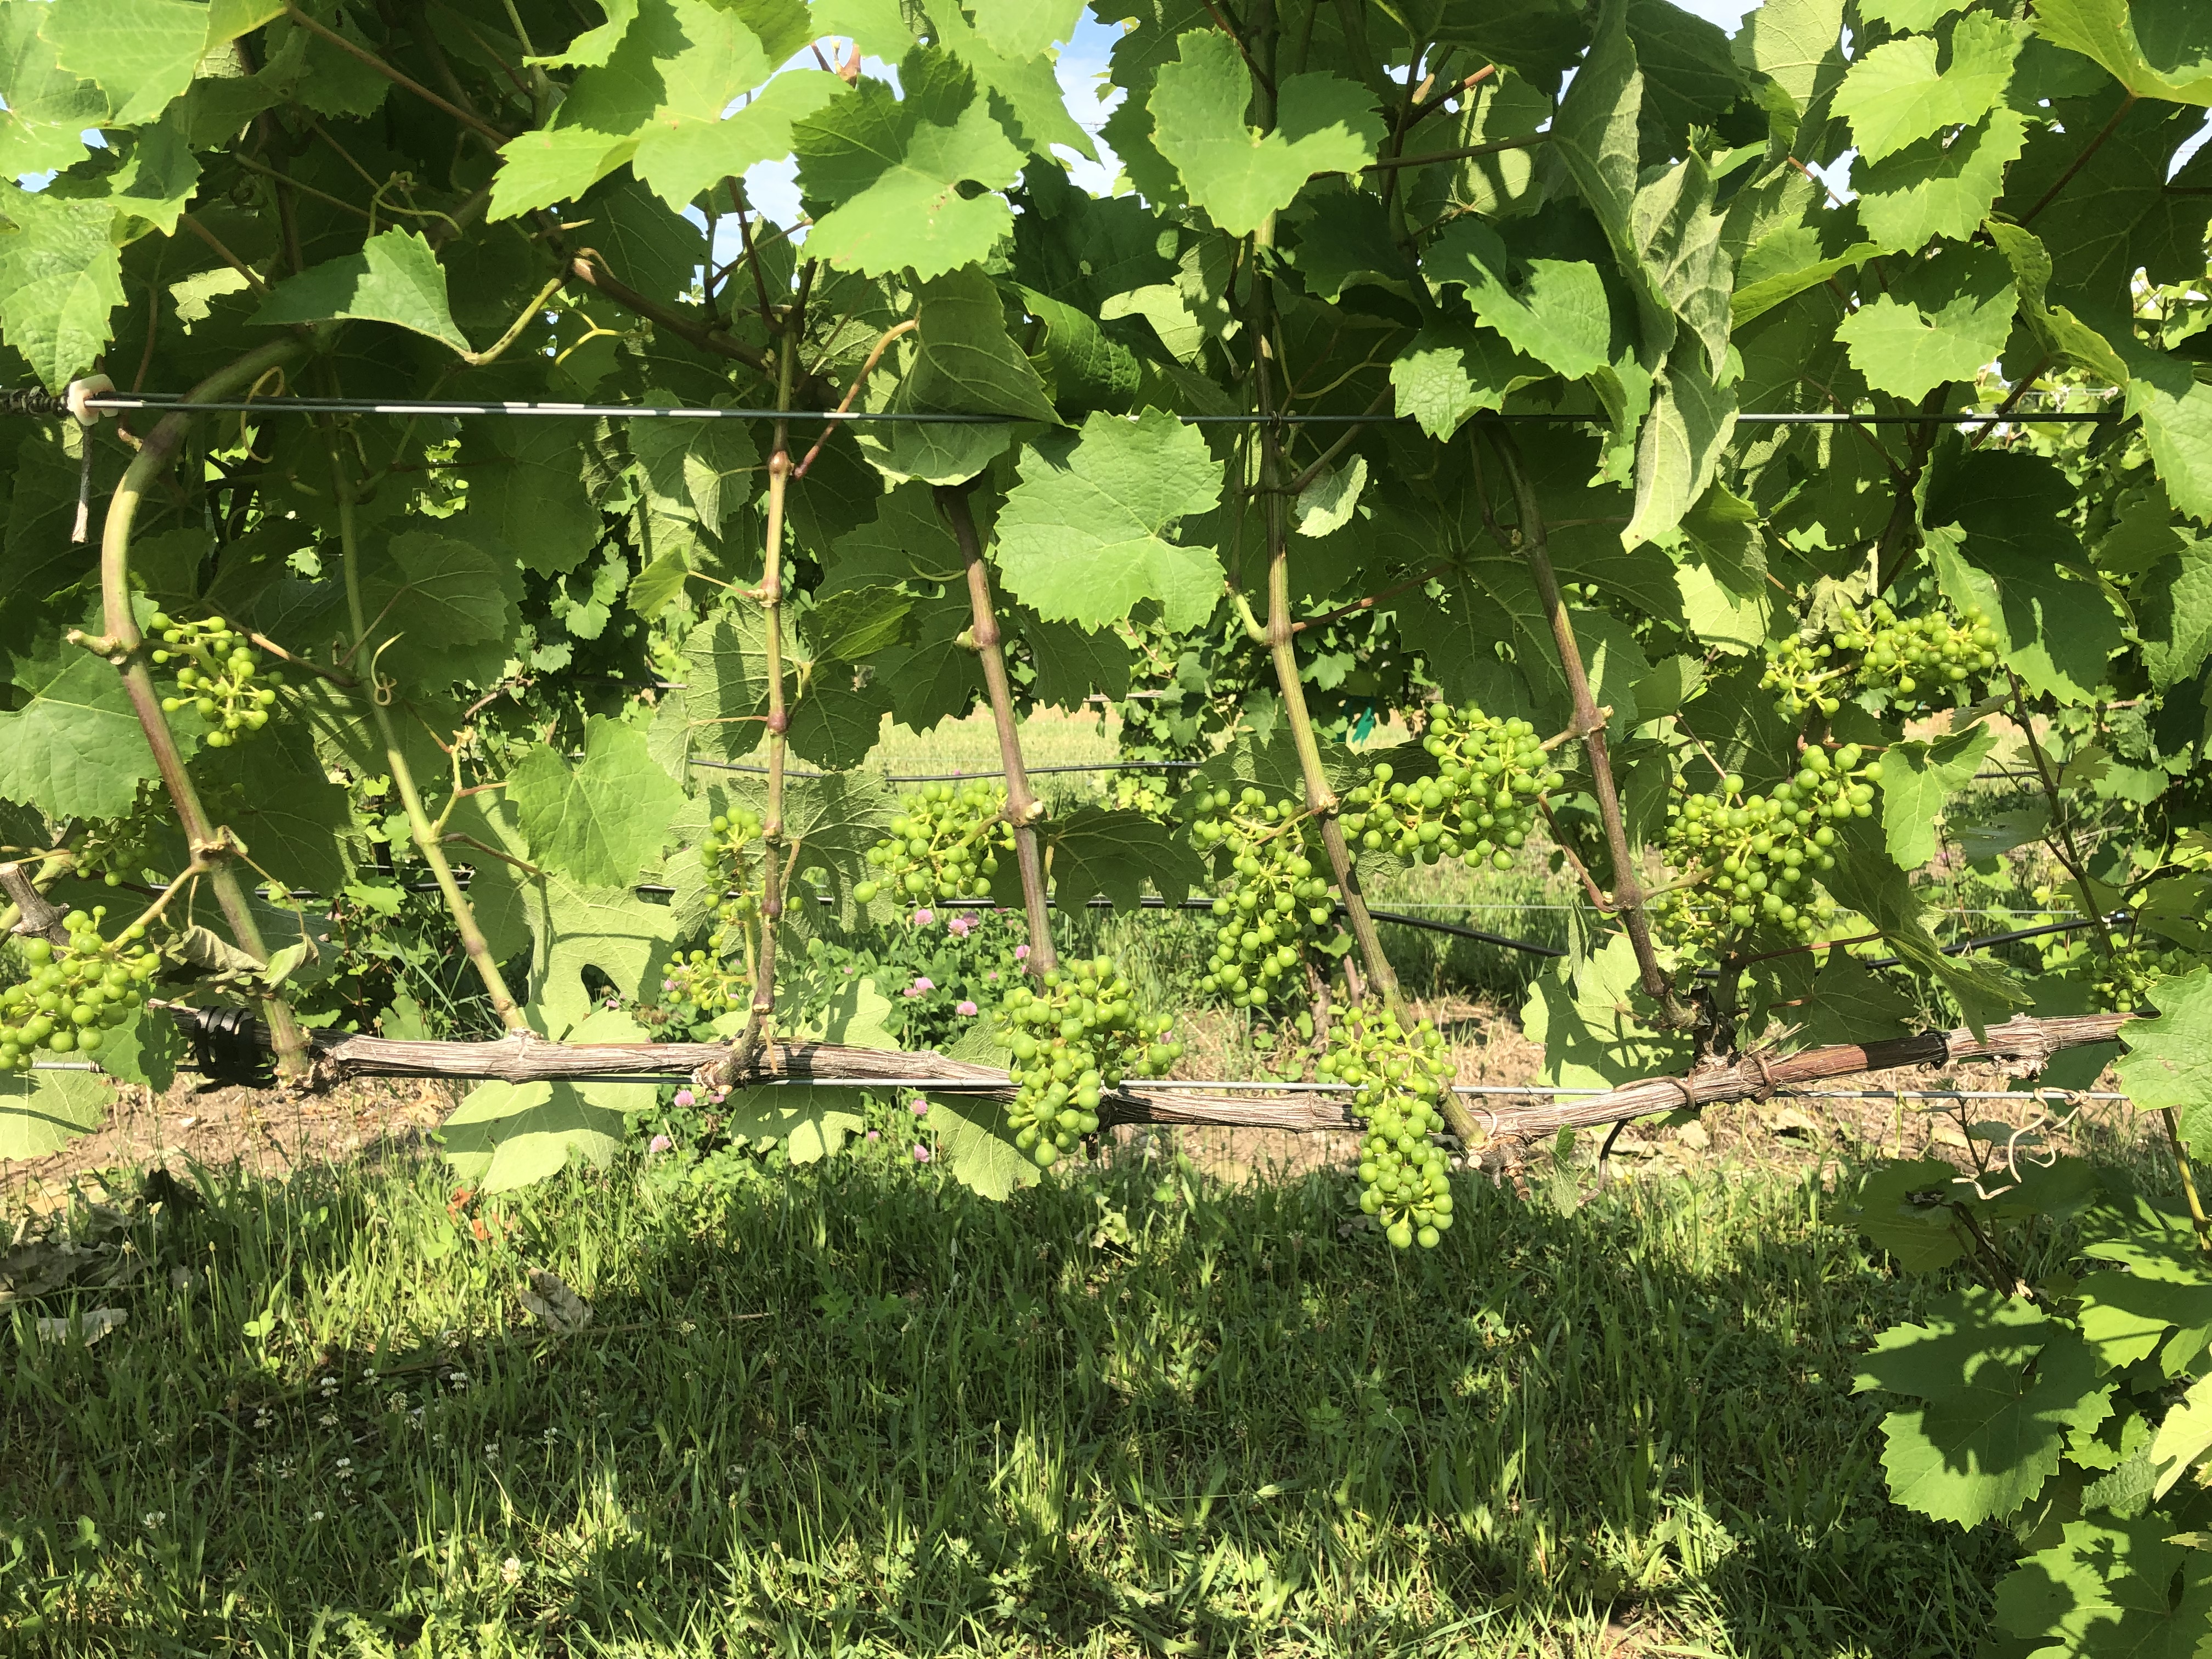
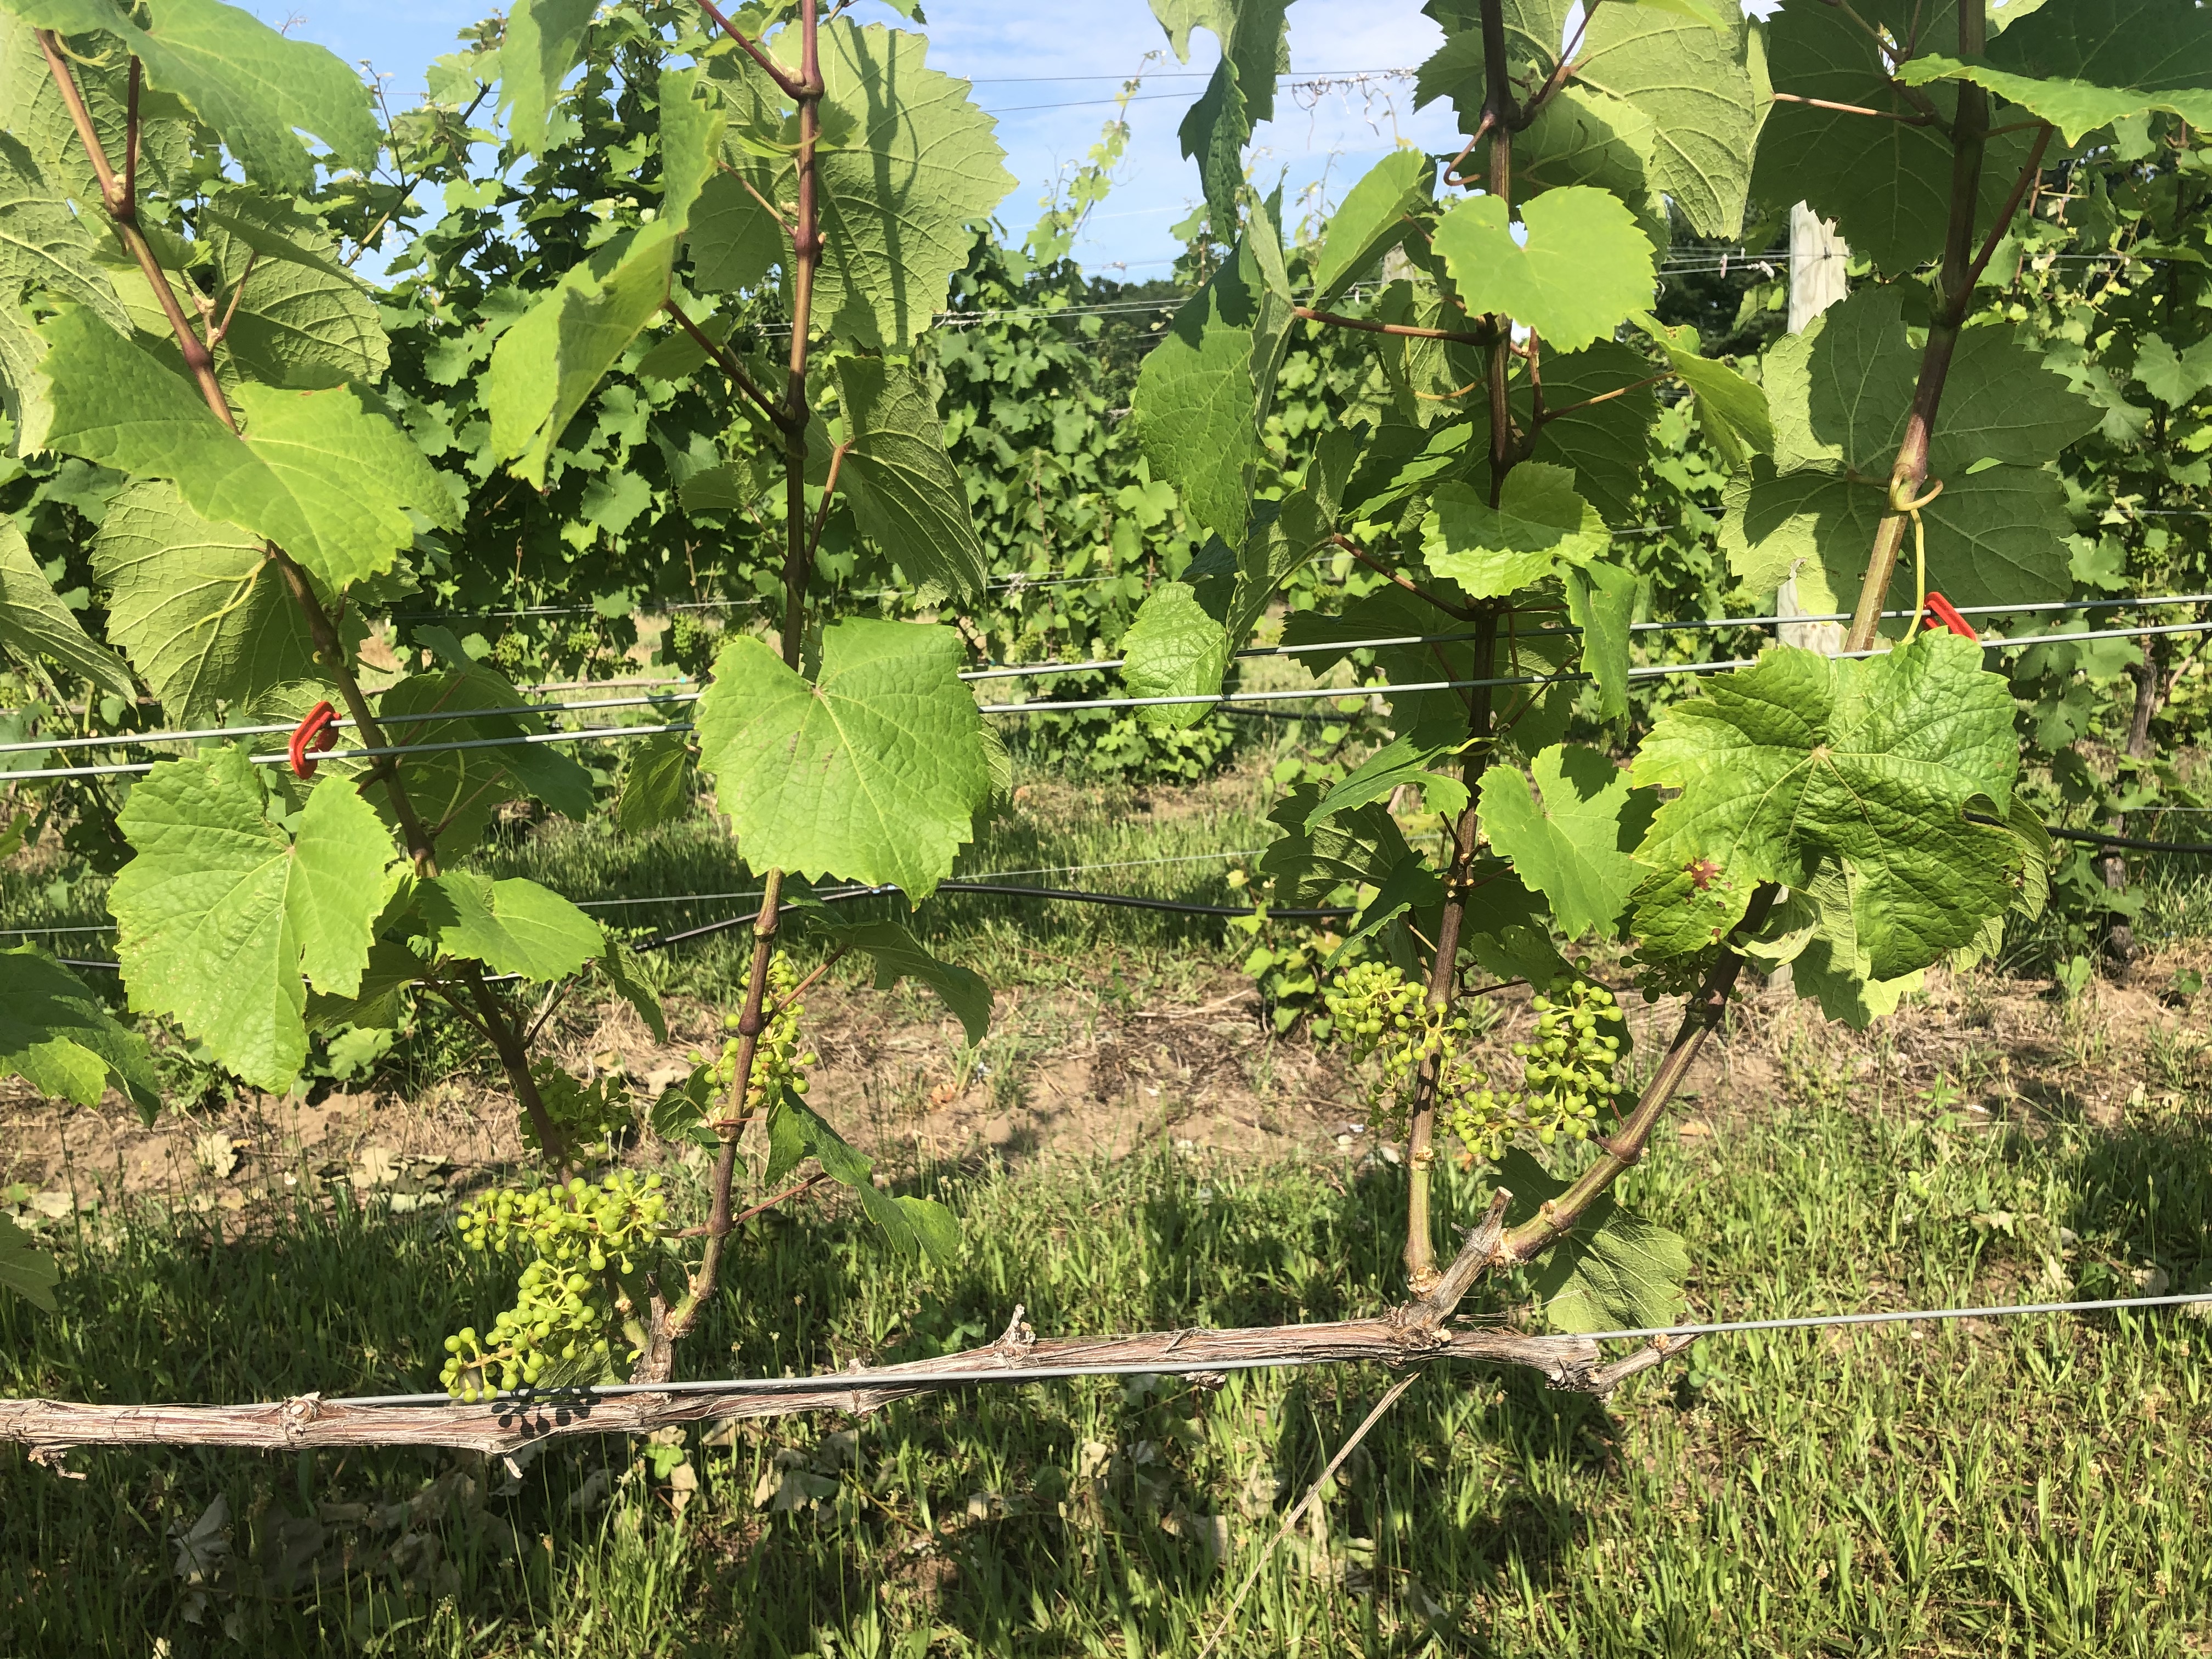
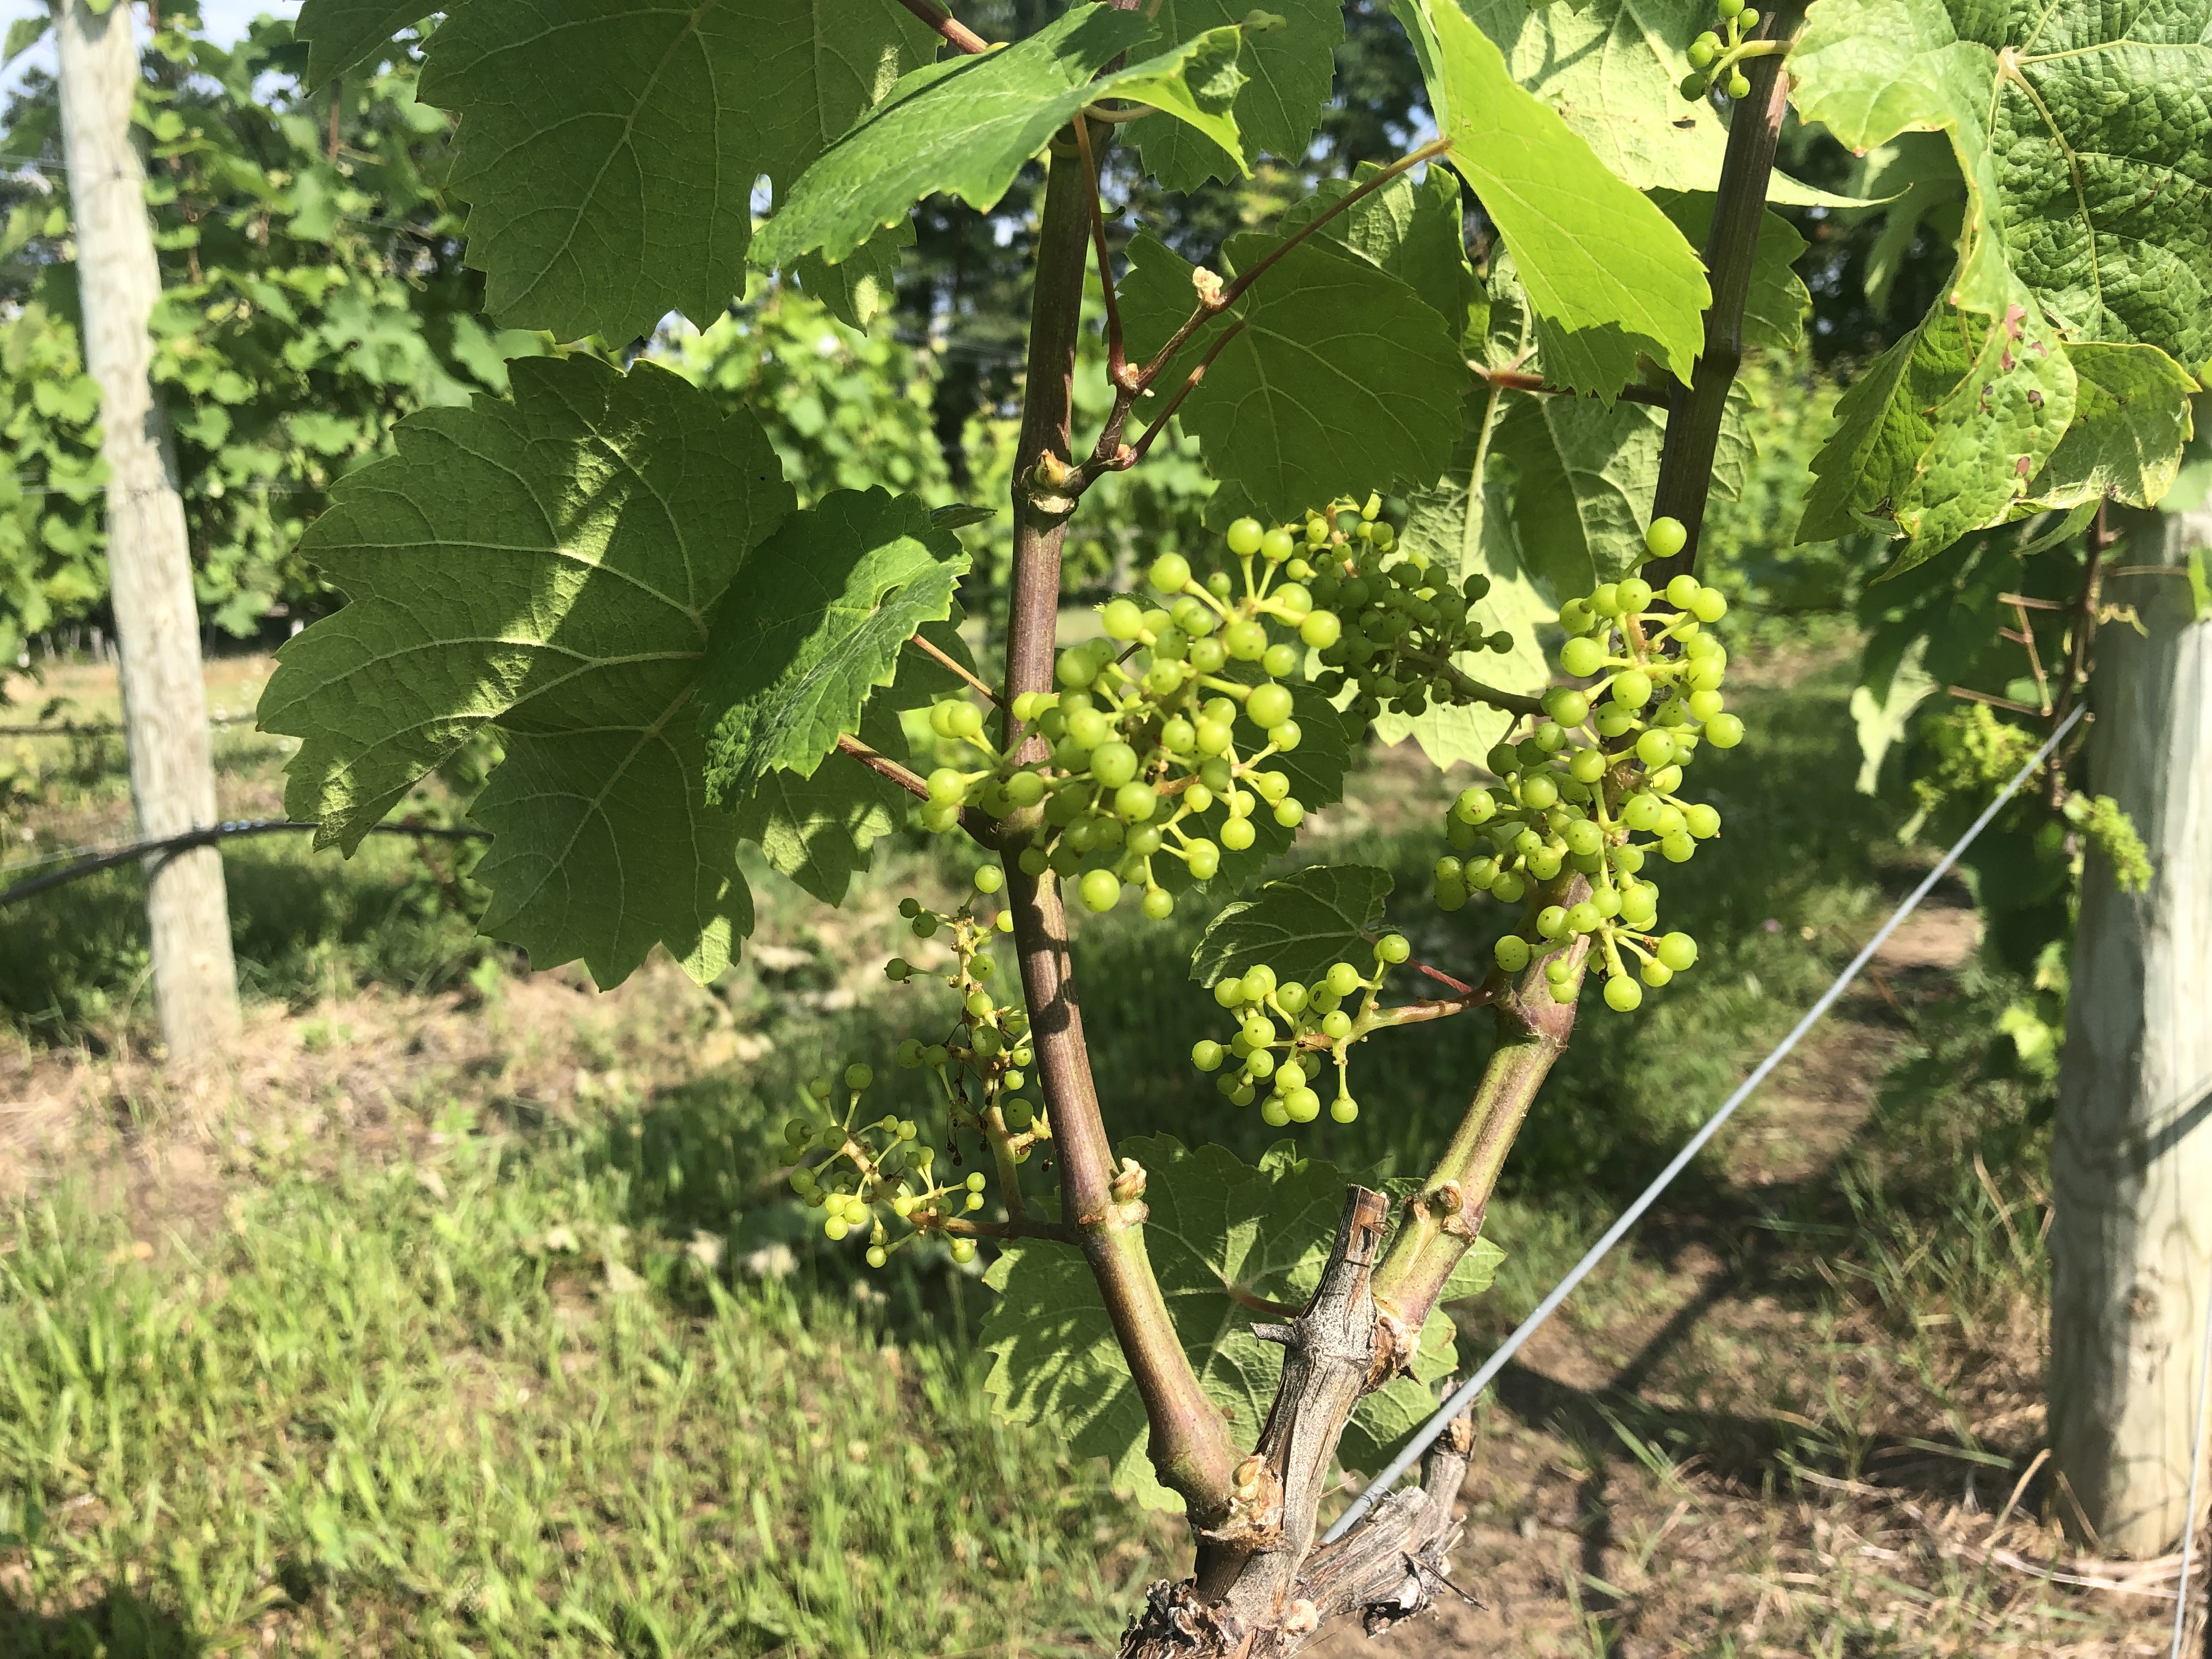
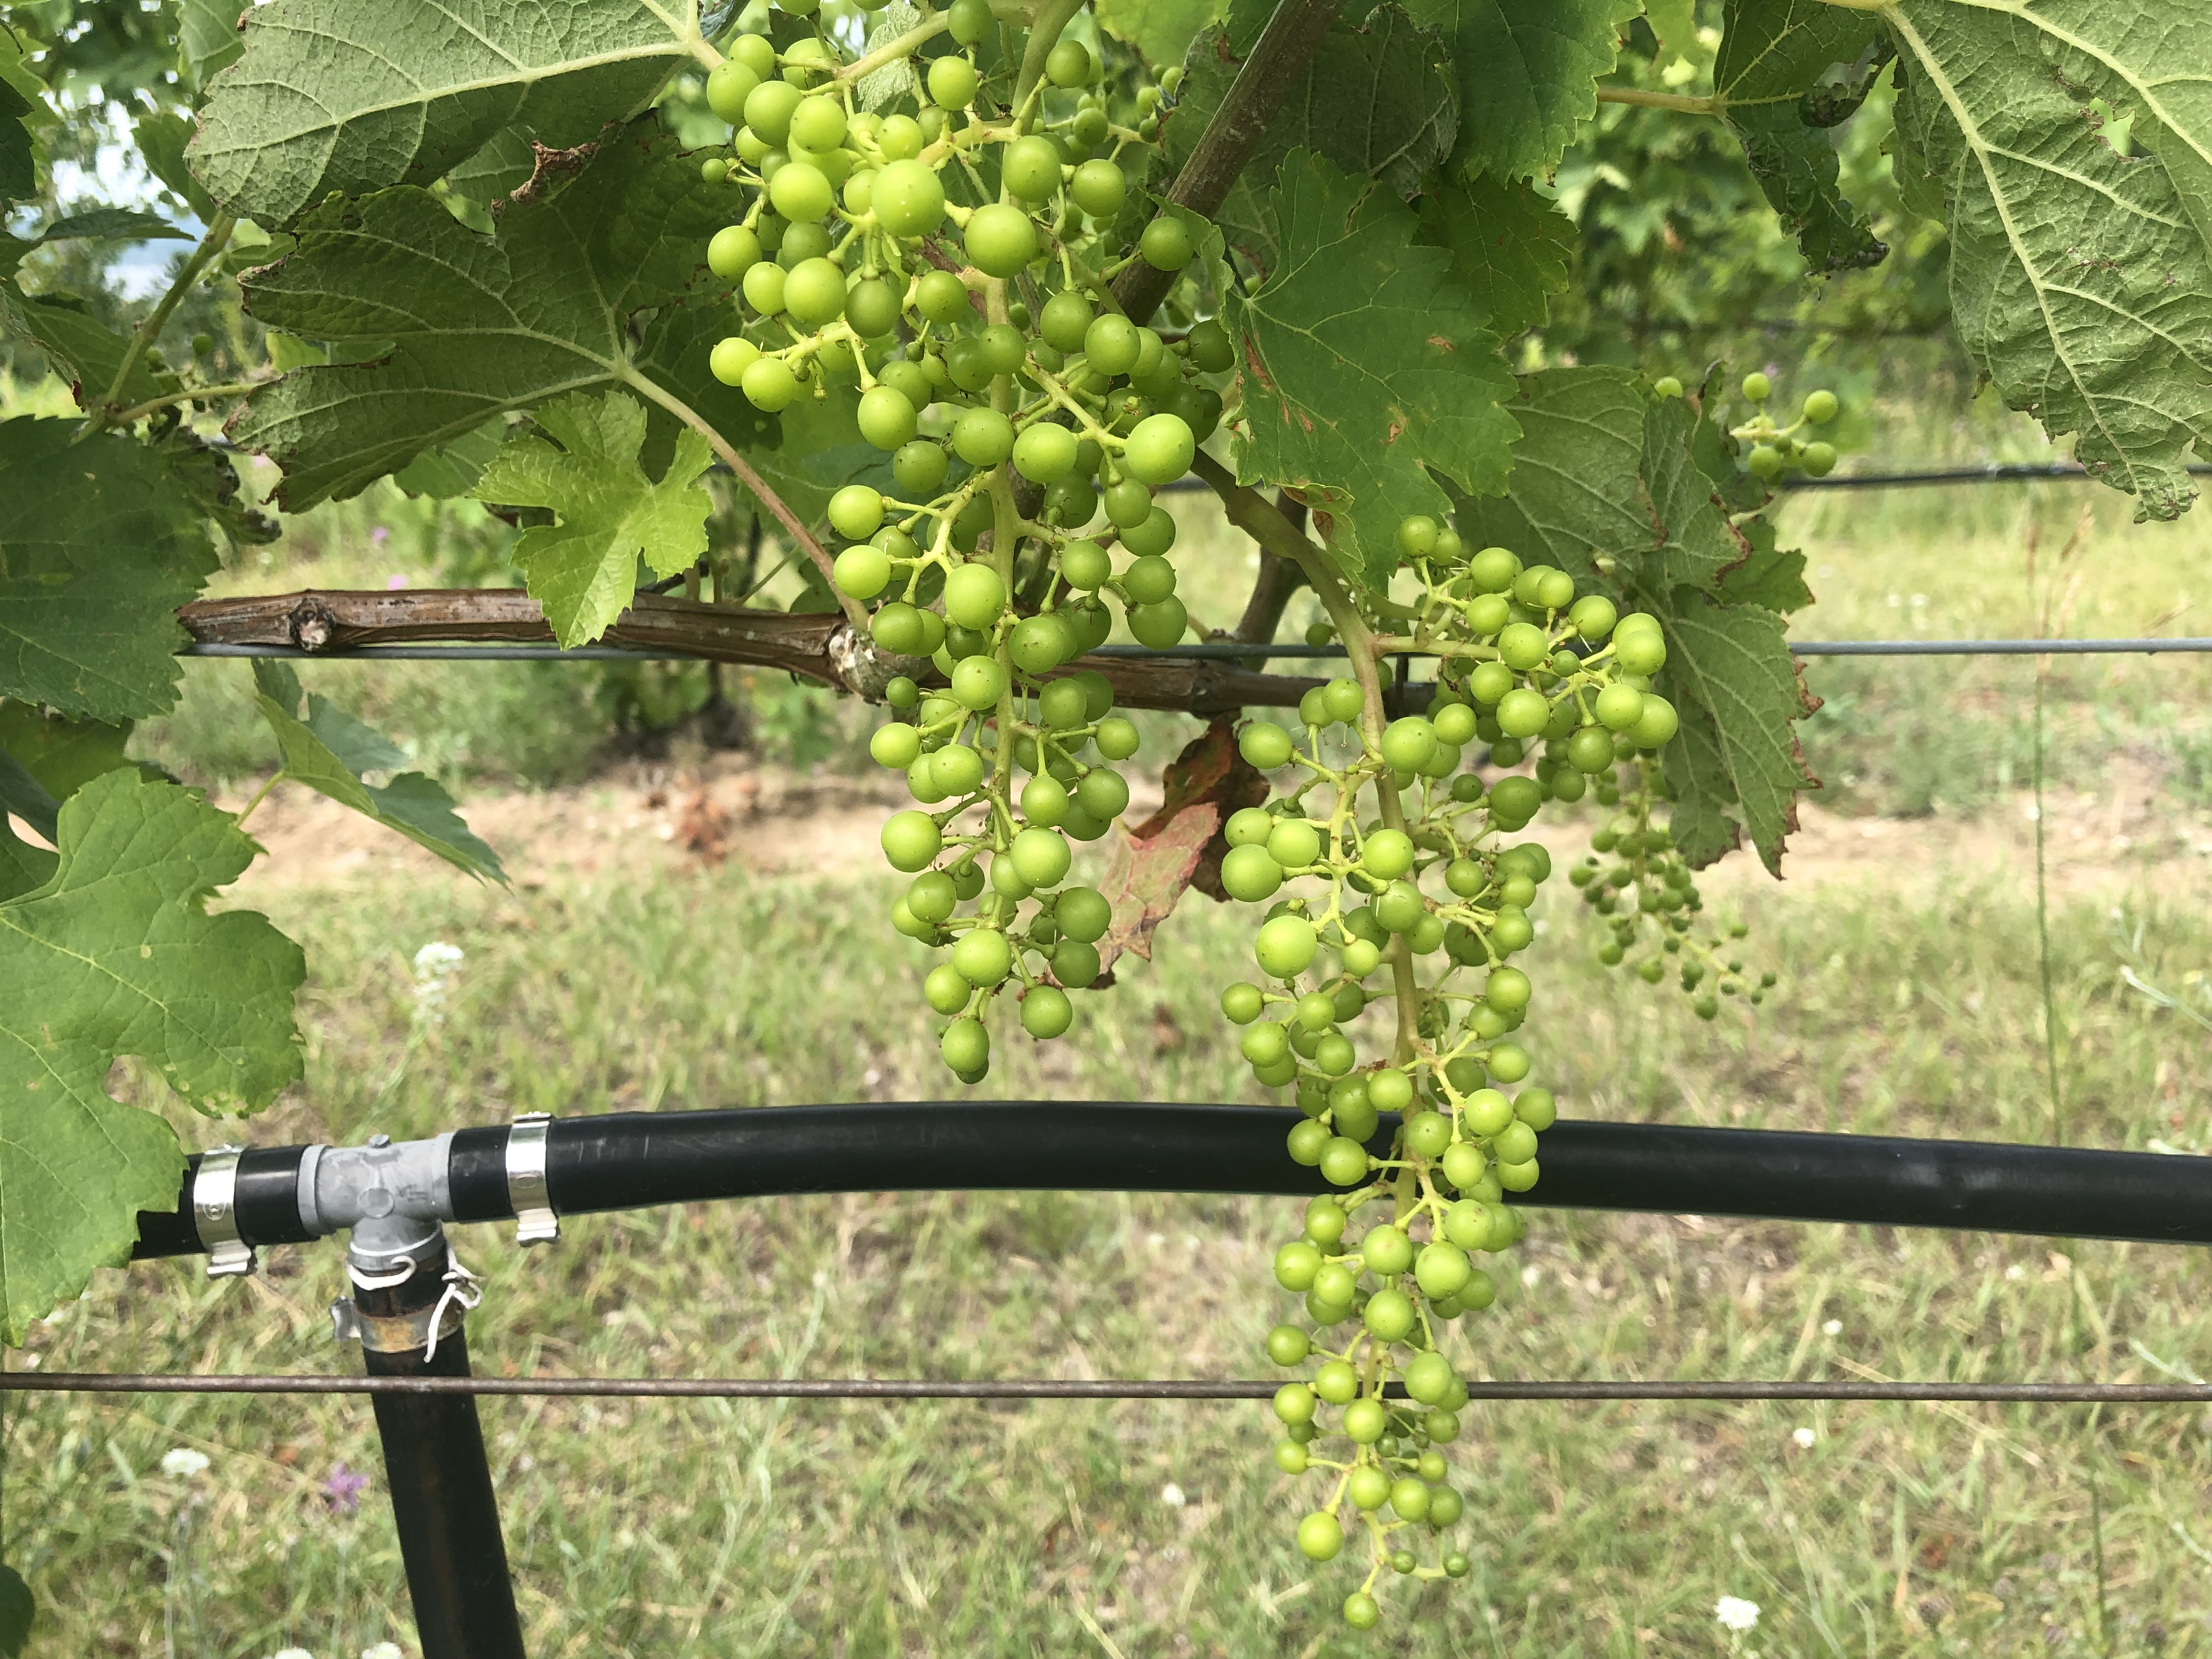
While the tepid temperatures have generally slowed growth and development, prolific precipitation has induced rapid shoot growth, resulting in increased demand for canopy management practices (fruit zone leaf removal, tucking and shoot training) and has instigated increased concern and chemical applications for future disease pressure like downy mildew, powdery mildew, botrytis and sour rot. Grapes are currently between the phenological stage of large pea-sized on cooler sites and large buckshot at warmer sites (Photos 1-5).
It is critically important to apply fungicide cover directly to the fruit zone (after fruit zone leaf removal) before clusters enter the berry touch stage of development. After berry touch, the clusters are too compact to accomplish complete surface area coverage of the individual grape berries and the fruit will more likely sustain rot damage.
The first half of the growing season has been cooler than normal, and there is interest in crop reduction to enhance and speed ripening. If you are interested in crop reduction via cluster thinning to hasten fruit ripening, use the following rule of thumb:
- Remove all fruit from shoots less than 12 inches long.
- Retain a maximum of one cluster per shoot on shoots between 12 and 24 inches long.
- Retain a maximum of two clusters per shoot on shoots longer than 24 inches long.
- The sooner the crop is reduced, the better the impact on retained fruit. In other words, do not wait; the time to limit crop to see actual benefits is right now.
Many wine grape growers have indicated that the success of this year’s vintage is squarely dependent upon a warm second half of the growing season, suggesting that at this point, just like in major league baseball, September and October are the only months that matter.