


Southwest Michigan field crops update – Aug. 5, 2021
 Print
Print Email
EmailCrops are progressing rapidly through reproductive stages, and rainfall is not expected to keep up with crop demand during next week’s return to summer-like temperatures.

Weather
Temperatures this past week were several degrees cooler than normal as predicted. This has eaten into our surplus of growing degree days (GDD) (heat units), but we are still 50-100 GDD base 50 ahead for this time of year. We will be returning to summer-like temperatures over the weekend with highs in the upper 80s to near 90 degrees Fahrenheit this coming week. The weekly forecasted evapotranspiration (FRET) rate for the coming week is roughly 1.25 inches with daily rates between 0.17 and 0.19 inch. The 6-10 day and 8-14 day outlooks both predict very strong chances of above-normal temperatures.
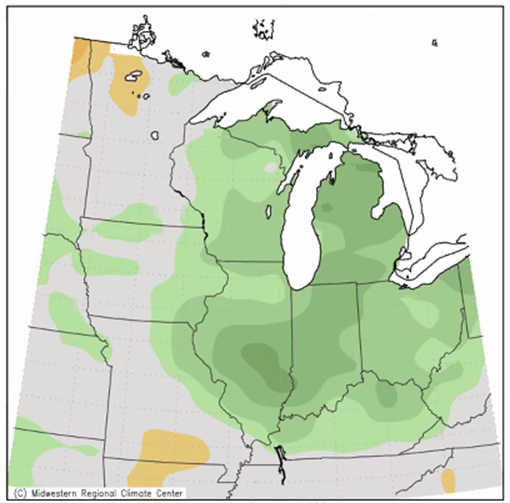

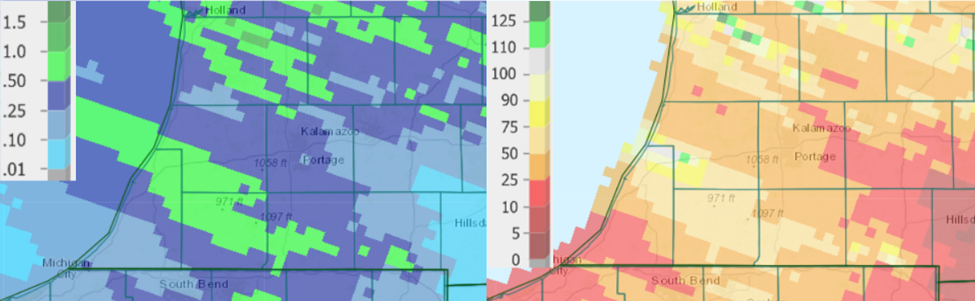
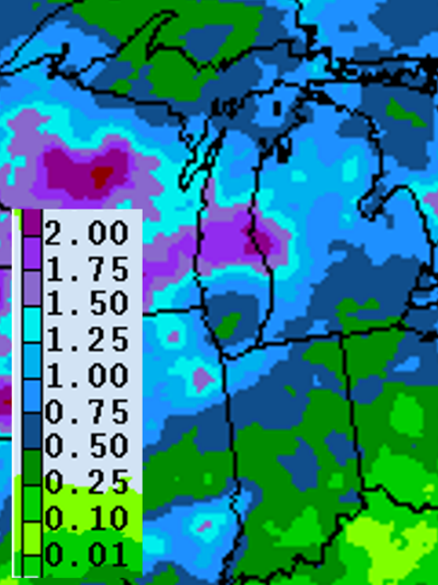
Rainfall this past week was not enough to keep up with crop demand with some areas receiving less than one-tenth of an inch while others further north in the region received closer to an inch. Although cooler temperatures helped to keep evapotranspiration rates somewhat lower, soil moistures have drifted to below-normal levels in southern Michigan.
The situation is not likely to improve in the near-term as less than 1 inch of rain is expected this coming week. There is a relatively low chance of rain on Saturday with the next best chance of significant rainfall on Monday into Tuesday with scattered showers predicted off and on next week. The 6-10 day outlook calls for higher-than-normal rain amounts while the 8-14 day provides no guidance.

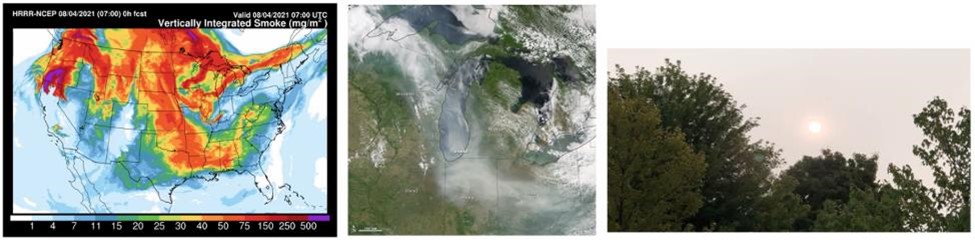
Haze in the region this past week, and particularly last weekend, was caused by smoke traveling on wind currents from wildfires in the northwestern states and western Canada. According to Michigan State University Extension agriculture climatologist Jeff Andresen, the impact on solar radiation has only been about 10%, and he has not found a good correlation between solar radiation and yield typically. In fact, he thought it might be beneficial in causing a slight reduction in temperatures and in scattering light rays, allowing for penetration of more light further down into the crop canopy. Likely, though, the smoke was just an interesting oddity with no real impact on the crops.
Crops and pests
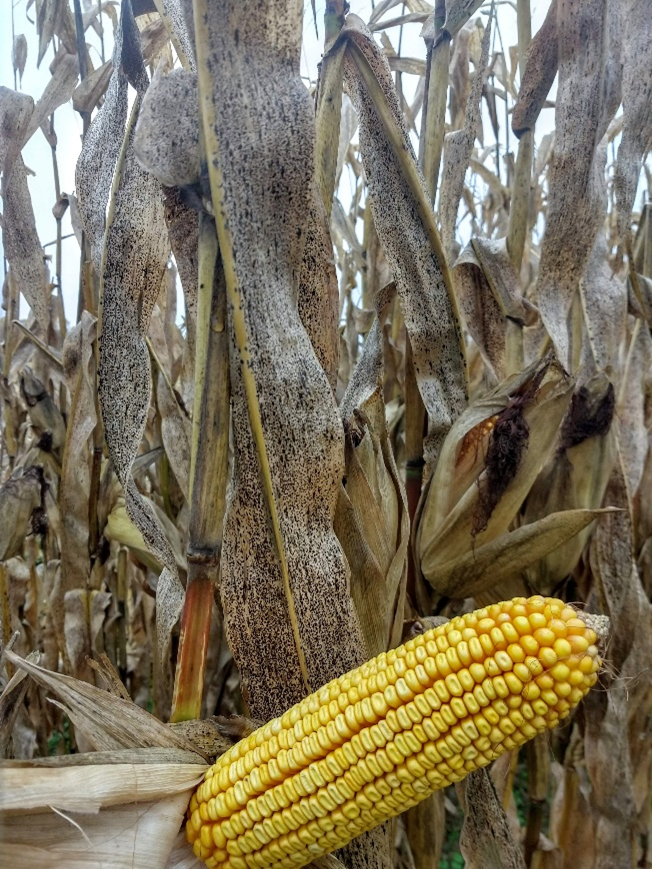
Early planted corn in the region has reached the milk (R3) stage while early planted soybean has reached beginning seed (R5, seed is 1/8 inch long in the pod at one of the four uppermost nodes on the main stem). Both crops will require roughly 1.5–1.6 inches of water this coming week. Corn will be progressing through reproductive sub-stages every four to five days, or every about 100 GDD50 (see the table below). With 180 GDD50 accumulation predicted for the coming week, early planted fields should be nearing the dough stage (R4) by next week and early dent (R5) the following week. When using cobs to determine stages, use the underside of the top of the cob.
Those growing silage corn and plan to test prior to harvest should consider participating in the 2021 Corn Silage Mycotoxin Survey. The MSU Agronomy Program is providing free testing of corn silage samples for 26 different mycotoxins as part of a state survey. Results on mycotoxins and quality will be shared with you, but your personal information will stay confidential. The form can be downloaded directly from MSU’s Cropping Systems Agronomy website. The testing is funded by Michigan Alliance for Animal Agriculture, Michigan Milk Producers Association, and Project GREEEN.

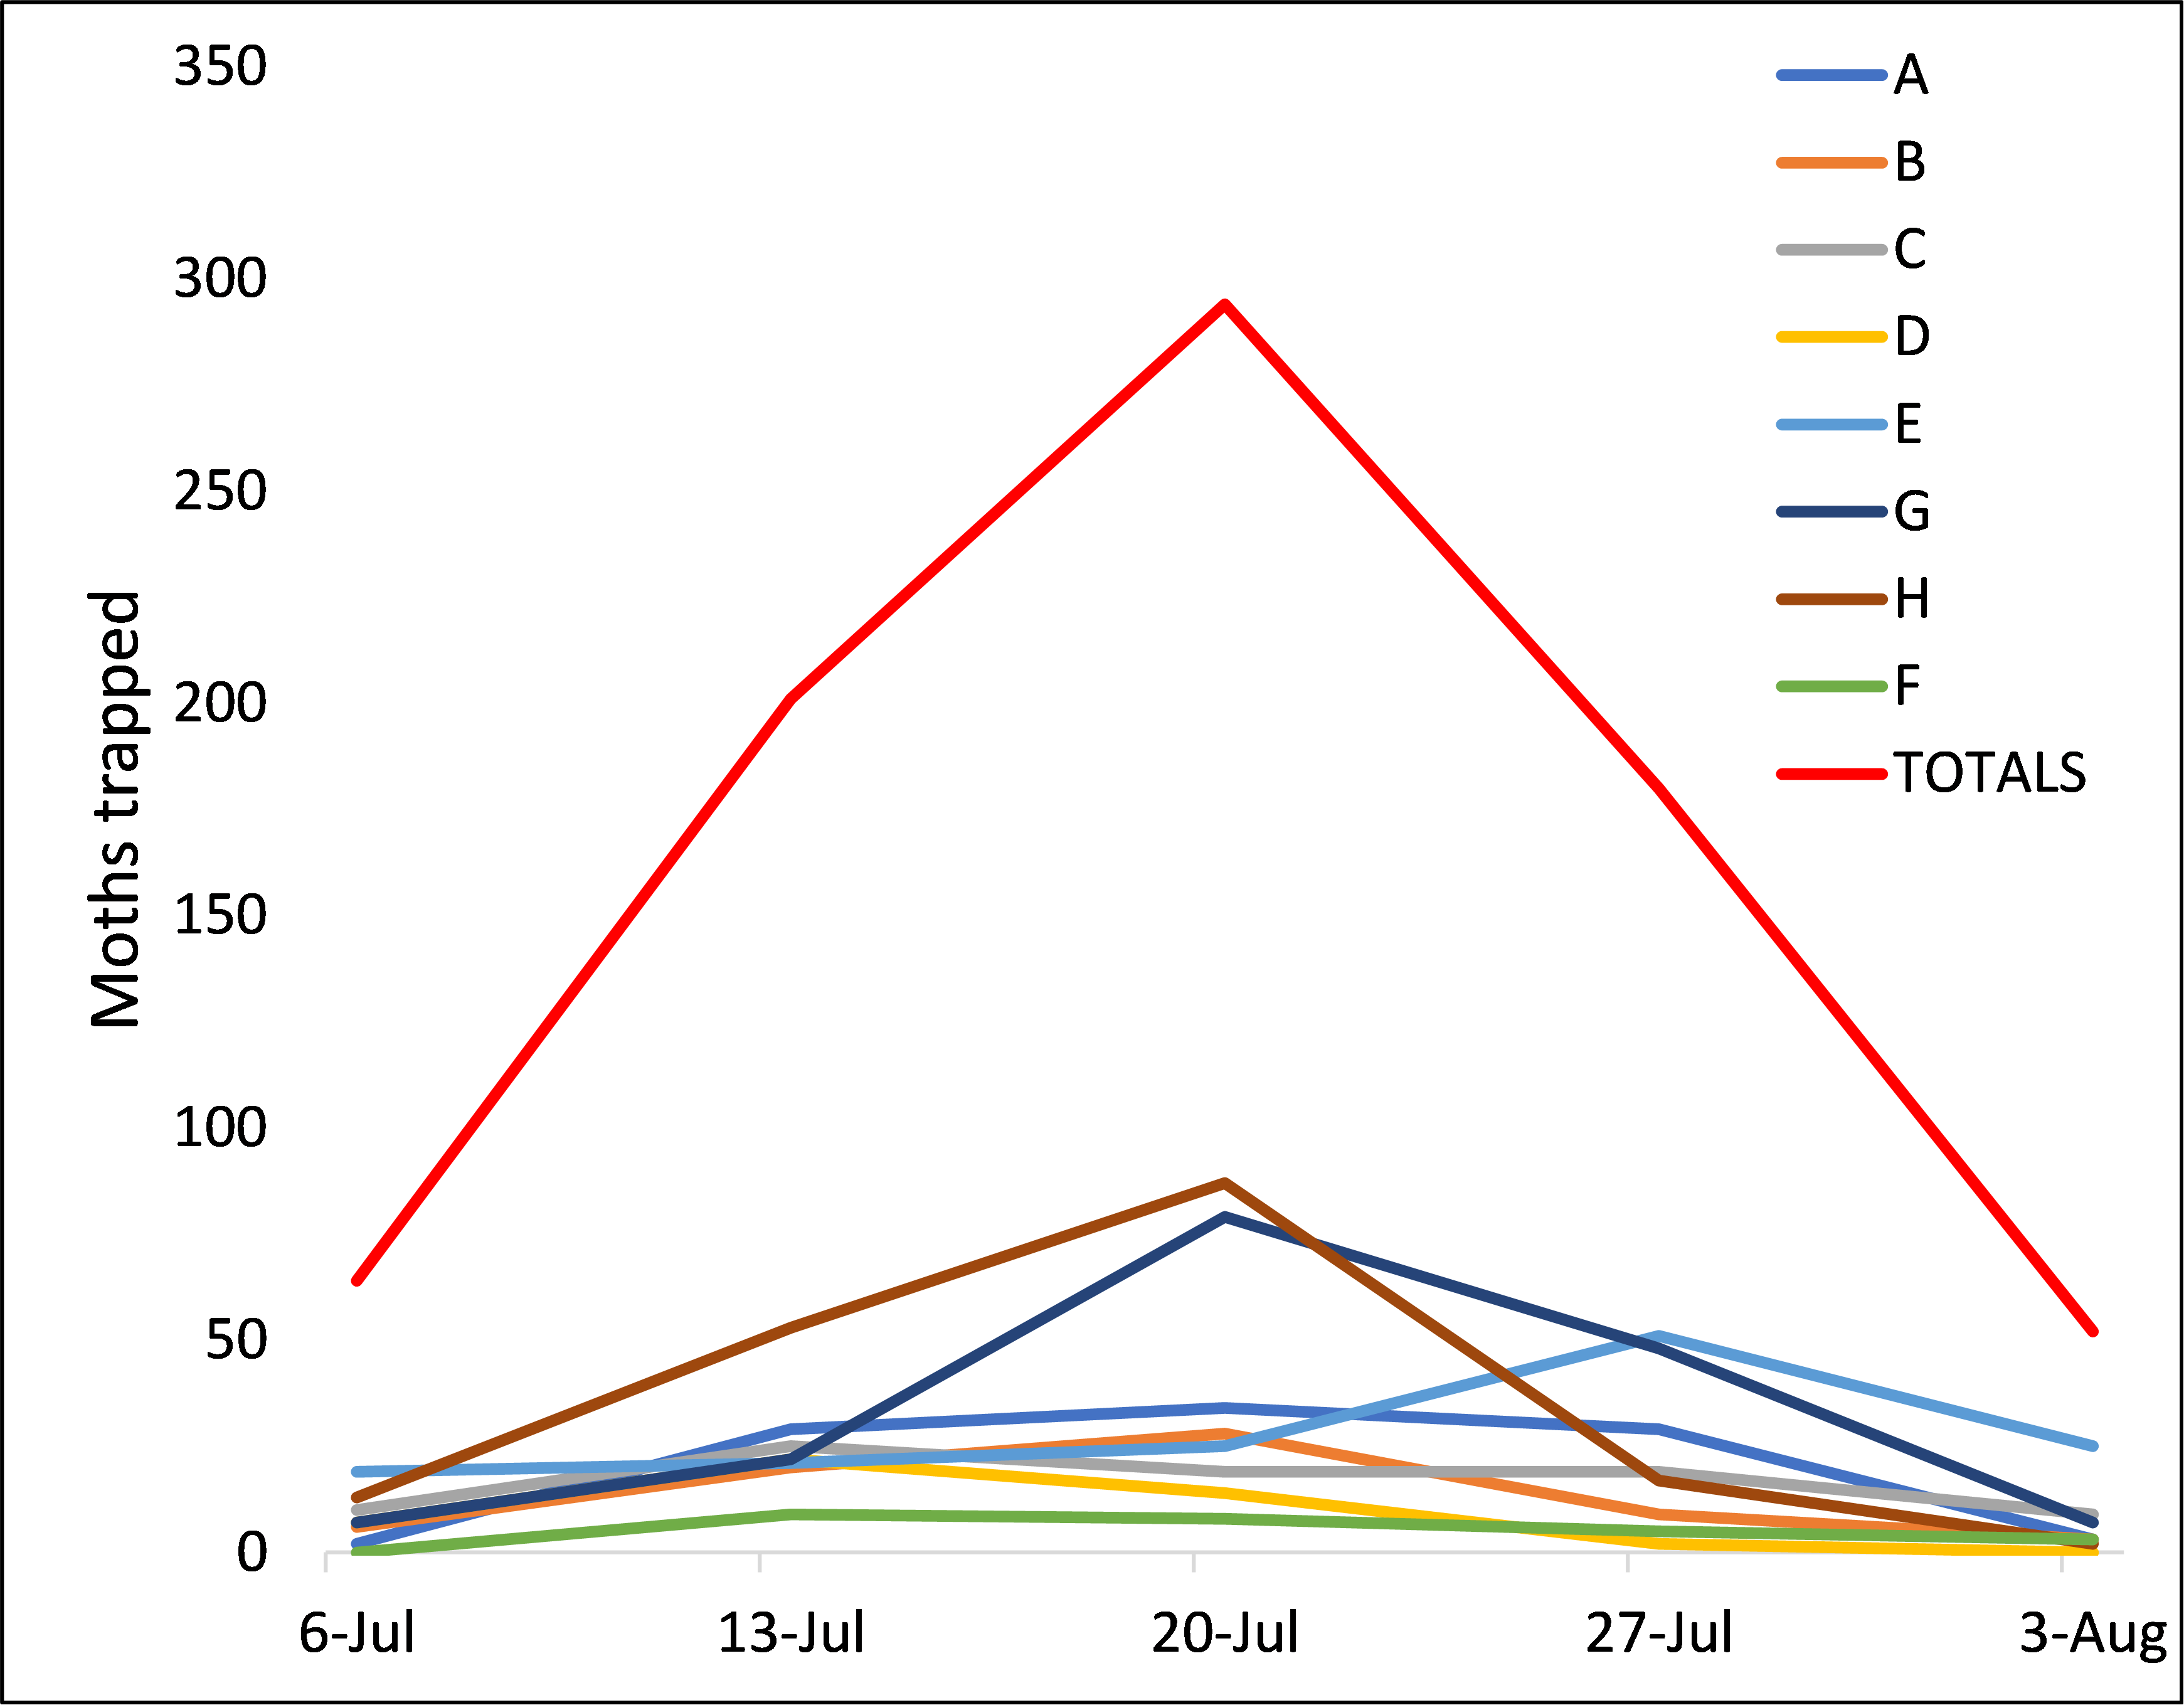
Western bean cutworm moth counts tapered off again last week, so we can safely say that peak flight was between July 13-20 this year. During the MSU Extension Field Crops Virtual Breakfast this week, MSU Extension field crops entomologist Chris DiFonzo told us everything we ever wanted to know (and more) about western bean cutworm life cycle, scouting and control. If you missed the session, the recording is available online and via the Team’s several social media platforms: Spotify, Apple Podcasts, YouTube, Facebook and Twitter.
She reminded us that if most of the corn in your area had already reached the tassel stage or later when female moths were laying eggs, they went searching for the ideal pre-tassel fields (when the tassel is still sheathed or just barely starting to emerge) which then became hotspots for egg laying. If you had fields that fit that description, particularly around the third week of July, be sure to scout those fields to determine whether adding an insecticide to a late fungicide application is warranted.
Diseases
Detection of tar spot in corn has been low throughout most of the state with very few lesions seen in fields visited thus far. MSU Extension field crops pathologist Marty Chilvers says that even if you have not seen tar spot symptoms yet, it is unlikely that it is not in your fields somewhere as the inoculum will be in the soil from previous years. With high dew points (into the 60s) predicted for at least the next week, the disease could progress rapidly, especially under irrigation, or if we do get several days of wet weather next week. We are nearing the end of the effective fungicide application window as earlier-planted fields reach R4 next week, so plan to scout now for disease severity in your fields.
Focus on management – evaluate your corn hybrids for tar spot performance
Yield monitors have given us a great way to collect data on corn, soybean and wheat performance in the most important location for you, your own farm. However, in and of itself, yield data does not tell the whole story of why yields may vary across your farm’s hybrid and variety selections. To be able to evaluate the story more completely, a good set of field notes should be matched up with the yield data. Modern drones have also given us the possibility of having the fields flown without significant costs. Often, this picks up differences in water retention in locations of fields. Multiple passes also can help to document when portions of the fields begin to decline, helping to pinpoint the timing of potential problems.
In the era of tar spot, particularly in heavily impacted areas such as southwest Michigan, evaluation of hybrid performance can be an important way to improve yields or reduce costs on your farm. Research has shown that there are big differences between hybrids ability to tolerate tar spot infections without significant yield losses. Hopefully the seed companies will be able to select more well adapted hybrids for our area to help reduce the impact of this fungal pathogen soon. We should continue to ask the companies for this information, but in the interim, evaluation of tar spot tolerance on the hybrids you already raise can pay big dividends when selecting next years seed.
There are at least three things growers should be looking at when evaluating tar spot in corn hybrids.
Step 1. Evaluate the relative disease severity in your hybrids. This can be accomplished by following the development of the disease in fields. Look at the number of tar spot lesions on the leaves on a regular basis as the season progresses. Relative numbers of lesions on leaves can be important, but there also seems to be differences between hybrid yield loss with similar numbers of lesions.
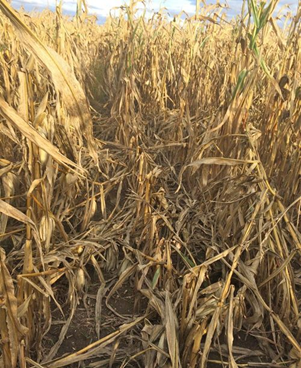
Step 2. Evaluate the length of time it takes for significant plant decline following the onset of leaf lesions. One potential way to do this is to look for yellowing or other discoloration of the leaves and husks. In severe cases, you can begin to smell the decline in the health of the leaves, husks and stalks, similar to the way you can smell areas of soybean fields that are infected with white mold (It sort of has a smell of hay that has been cut that has been rained on.). Of course, the overall yield impacts on any hybrid will likely depend upon the growth stage that the plants show significant decline. The more mature the plant at the time of severe infection, the less likely a significant yield loss from kernel size and test weight will occur. Heavy rainfall over extended periods, cloudy, misty or foggy conditions promote the disease. The critical duration of leaf wetness to begin to enhance infection is thought to be greater than 7 hours. Irrigation just prior to the onset of these kinds of conditions can increase the incidence of tar spot infection in watered fields.

Area wide infection seems to occur following an outbreak tar spot in a few susceptible fields. This can be caused by thunderstorm activity, prolonged irrigation, or a combination of both in the same area. Once spore production gets cranked up, we often see tar spot infection across a much wider area (perhaps county wide or more) approximately two to three weeks following the initial outbreak. This closely follows the time it takes for the lesions in the outbreak fields to produce spores. This is often why we see much more incidence of tar spot lesions in fields later in the season, in mid to late August, and early September.
Step 3. Evaluate the decline in stalk strength in infected fields. Yield losses can occur as described above. Another important mechanism of yield loss can come from extreme lodging of infected fields. Corn plants translocate carbohydrates from leaves and stems into the developing kernels under normal circumstances. If leaf tissues are in decline, the plants scavenge more carbohydrates from the stalks, reducing stalk strength. This can lead to excessive lodging. There is nothing more frustrating than trying to harvest lodged corn, especially when dodging lake effect snow showers in fall. You can often see the impacts of tar spot infection the next year as volunteer corn in fields.
While the hyperlinked article above focuses on corn tar spot symptoms, the concept of making multiple field evaluations during the growing season can be used to help identify soybean challenges as well. You can evaluate your varieties susceptibility and performance in avoiding yield losses to important diseases such as sudden death syndrome and white mold, seedling and root diseases and impact from soybean cyst nematode populations.
Irrigation
Join us for the next MSU Irrigation Webinar on Aug. 18 where the topics of irrigation management efficiency as well as irrigating vegetable, tree fruit and ornamental crops will be discussed. The cost is free. Register online to receive the link, which will be used for all episodes in the series that air every other Wednesday through Sept. 15.
