Bulletin E-3415 Introduction to Crop Insurance for Field Crops
DOWNLOADJuly 12, 2021 - Jonathan LaPorte, MSU Extension
 Print
Print Email
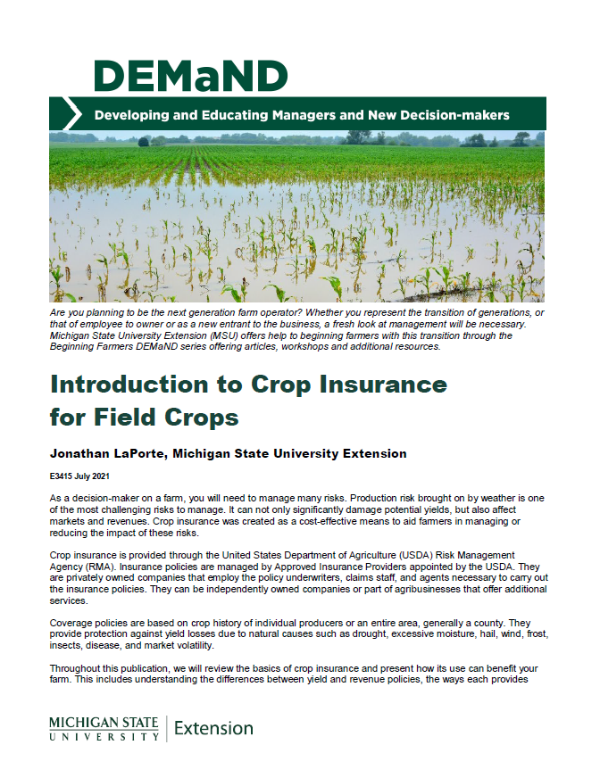
EmailAs a decision-maker on a farm, you will need to manage many risks. Production risk brought on by weather is one of the most challenging risks to manage. It can not only significantly damage potential yields, but also affect markets and revenues. Crop insurance was created as a cost-effective means to aid farmers in managing or reducing the impact of these risks.
Crop insurance is provided through the United States Department of Agriculture (USDA) Risk Management Agency (RMA). Insurance policies are managed by Approved Insurance Providers appointed by the USDA. They are privately owned companies that employ the policy underwriters, claims staff, and agents necessary to carry out the insurance policies. They can be independently owned companies or part of agribusinesses that offer additional services.
Coverage policies are based on crop history of individual producers or an entire area, generally a county. They provide protection against yield losses due to natural causes such as drought, excessive moisture, hail, wind, frost, insects, disease, and market volatility.
Throughout this publication, we will review the basics of crop insurance and present how its use can benefit your farm. This includes understanding the differences between yield and revenue policies, the ways each provides protection, and the advantages offered by each. We’ll also review how USDA RMA provides beginning farmers with additional benefits within crop insurance to assist in managing risks.
Basics of Crop Insurance
Crop insurance for field crops typically looks at protection coverage based on area risk (usually county) or individual producer risk. Area risk bases protection on county-level production. Individual producer risk is centered around the farm’s actual production.
The programs differ in other ways. Both have different coverage ranges from which indemnity (loss) payments will begin to calculate. Area risk protection offers a range of 70% to 90% of county production levels. Individual producer policies have a coverage range from 50% to 85% of the farm’s actual production. Each incremental increase in coverage also brings with it a higher insurance premium you will need to pay.
Individual producer coverage can be further enhanced in additional ways. Insurance policies are set by crop per county and types of practices. If you have a crop that has irrigated and non-irrigated practices, you can insure them separately. You can also choose the type of insurance unit based on the farm’s field organization. It is sometimes helpful to think of each unit as its own profit and loss center to manage.
The types of units include basic, optional, or enterprise:
In a basic unit, the entire crop is divided by the ownership split. For example, all owned and cash rent land can be considered an individual basic unit, while land in a share agreement with the landlord would a separate individual basic unit.
In an optional unit, the basic units of a crop are divided by the township section that they are located in. This is helpful if fields in different township sections have significant variability. For example, fields in one township section may have a sandy loam soil type, while fields in a different township section may have a clay soil type. This presents different challenges that may warrant insuring the fields separately. Individuals using optional units must keep separate production records for each unit.
In an enterprise unit, the entire farm’s crop is grouped together per county, regardless of where the fields are located. While an optional unit is helpful if there is variability in the farmland, an enterprise unit is helpful if there is more uniformity. There is a significant premium discount for enterprise units when compared to basic and optional units. In some situations, they can even cross county borders. To use enterprise units, certain eligibility criteria must be met. For more information, visit the USDA RMA website’s Frequently Asked Questions on Enterprise Units (https://www.rma.usda.gov/News-Room/Frequently-Asked-Questions/Enterprise-Units).
Area risk coverage can be further enhanced as well. This is done by selection of a maximum policy protection factor. Factors range from 0.8 (minimum) to 1.2 (maximum). The factor helps to calculate the final protection level, which is the amount of coverage a producer can purchase. For example, a producer has elected 90% coverage and is expecting a county revenue deficiency payment of $58.79 per acre (county revenue guarantee minus actual county revenue). The producer also selected a protection factor of 1.2 and has their revenue deficiency payment enhanced to $97.98 per acre. This is calculated by multiplying $58.79 by 1.2 and then dividing by a coverage loss limit factor of 0.72 (90% coverage minus 18% loss limit). If the producer had elected a factor of 0.80, the same calculation would have resulted in a payment of $65.32 per acre. Remember that the higher the protection factor, the higher the premium that will be paid for the enhanced coverage.
While both programs have differences, there are also similarities. Both use the farm’s actual planted acres in establishing an indemnity payment. Each program also requires production reporting to ensure accurate calculation of any payments. If production is not reported, each program has a series of consequences that will affect future coverage. For example, in area risk protection, the protection factor will be reduced to 0.8 the following year if reports are not timely filed. Both types of insurance also have coverage that focus on protection against production (yield) loss, revenue loss, or a combination of both.
Moving forward, this publication will focus on examples and discussion of the yield and revenue aspects of individual producer coverage. For more information on area risk protection insurance, visit the USDA’s RMA Fact Sheet on the program (https://www.rma.usda.gov/en/Fact-Sheets/National-Fact-Sheets/Area-Risk-Protection-Insurance).
Yield Protection
Yield protection policies safeguard against losses to the crop yield only. The yield being covered is referred to as the yield guarantee. The guarantee is calculated by using a percentage from a range of 50% to 85%, in 5% increments, which you, as the insurance holder, select. The guaranteed percentage is then multiplied against an average of the farm’s historical production records. These records are crop yields the farm has achieved in prior years. Historical production records are also referred to as actual production history (APH). A minimum of four years and a maximum of the last 10 years are used to determine the APH.
The APH is an important component of all individual policies as it sets the minimum coverage level you can expect during a production year. That importance can be seen in the options RMA has to help keep your APH at the highest possible level.
T-Yield or Transition Yields
For individuals without production history in any of the first four years of having the insurance, you can use a T-yield or transition yield. T-yields are calculated for each crop within a county. The amount of production history a farm has will determine the percentage of the T-yield that can be used. With no yield history, you can use 65% of the T-yield. One year of yield history will receive 80%. Two years receives 90%. If you have three years of historical yields, you can use 100% of the T-yield in the fourth year. Example 1 illustrates how these values are used in calculating an APH.
|
Example 1. Calculating an APH Yield Using T-Yields |
|||||
|
Years |
No records |
1 year of records |
2 years of records |
3 years of records |
4 years of records |
|
Year 1 |
140 bu. x 65% = 91 bu. |
180 bu. |
180 bu. |
180 bu. |
180 bu. |
|
Year 2 |
140 bu. x 65% = 91 bu. |
140 bu. x 80% = 112 bu. |
165 bu. |
165 bu. |
165 bu. |
|
Year 3 |
140 bu. x 65% = 91 bu. |
140 bu. x 80% = 112 bu. |
140 bu. x 90% = 126 bu. |
170 bu. |
170 bu. |
|
Year 4 |
140 bu. x 65% = 91 bu. |
140 bu. x 80% = 112 bu. |
140 bu. x 90% = 126 bu. |
140 bu. x 100% = 140 bu. |
160 bu. |
|
APH yield |
91 bu. |
129 bu. |
149.25 bu. |
163.75 bu. |
168.75 bu. |
To find the T-yield for your crop and county, visit the RMA Actuarial Information Browser found at the following website: https://legacy.rma.usda.gov/tools/. On the Actuarial Information Browser screen, (click on “Actuarial Information Browser”) select the “reinsurance year” you wish to view. Often the most current year available is selected. Then choose the commodity, commodity year, type of insurance plan, state, and county. The screen will provide a series of tabs, the one marked T-yield will provide the information for that selected crop.
Quality Loss Option
The quality loss option acts similar to a replacement yield but provides additional support to maintaining your farm’s APH. The option has to be endorsed prior to the insurance sales closing date. However, if you don’t end up using it, you don’t pay for it as part of your insurance premium.
Quality losses can occur from damage, disease (such as mycotoxins), or even low test weight. Discounts from quality losses are often listed as a dollar per bushel charge on a sales receipt. For APH records, discount values are converted to a bushel reduction of that year’s production yield total. If yields are reduced, they can be replaced with their pre-quality adjusted values. Ensuring that actual harvested production is still used towards your ongoing yield history.
Example 2 outlines pre-quality and post-quality yields that a quality loss option considers. A quality loss option would keep the pre-quality adjusted yields in 2021 and 2023. Establish an average of 115 bushel APH. If post-quality adjusted yields were used, coverage would be based on a lower APH of 90 bushels instead.
|
Example 2. Quality Loss Option |
||
|
Crop Year |
Pre-Quality Adjusted Yield |
Post-Quality Adjusted Yield |
|
2020 |
120 |
120 |
|
2021 |
100 |
50 |
|
2022 |
130 |
130 |
|
2023 |
110 |
60 |
|
Average |
115 |
90 |
Yield Adjustments, Cups, and Exclusions
There are additional options to help maintain your farm’s APH level and provide coverage in the event of a loss. These include a yield adjustment, yield cup, and yield exclusion.
A yield adjustment uses the T-yield in substitution for poorer yield in a given year. If chosen, the adjusted yield would be equal to 60% of the T-yield for that crop.
A yield cup is an add-on option to the yield protection policy that allows you to safeguard against the effects a poor yield may have on your farm’s APH. It ensures that the APH will not drop by more than 10% of its current level in the year the poor yield is added to your history.
A yield exclusion is an option to exclude a yield when calculating your farm’s APH. The exclusion becomes available when RMA determines your county’s yield has fallen below 50% of its 10-year average APH. The same option can also be triggered by contiguous counties experiencing a similar low yield situation.
These options are helpful if you are new to farming, adding a new crop or enterprise, or have recently purchased additional land with no APH.
Trend Adjusted APH
The historical trend of crop yields is tracked within each county. Within the insurance policy is an option to adjust your APH so that it follows the county’s trend yield for the crops you raise. This increase in your APH adds to the bushels insured by your coverage level percentage.
To do this, you must be in an eligible county and have at least one APH database with an actual yield in one of the four most recent crop years for the crop in your county. This does not affect the yield cup option and yield adjustments or exclusions are inserted before a trend adjustment is made.
An additional premium cost is involved in using a trend adjustment option. However, the cost per insured bushel is often cheaper than an additional 5% in coverage level.
Additional APH Support for Beginning Farmers
Beginning farmers are given additional support to maintain or establish APH levels. Establishing as a “new producer” allows you to use 100% of the T-yield for two years in your APH. You must not have had any grower interest in that crop to qualify for this option. When a yield adjustment is requested, 80% of the T-yield can be used instead of the standard 60% allowed to established producers. You also have the option to use the APH of a farm operation that you were previously involved in. To do this, you must have been involved in decision-making or physical activities to produce the farm’s crops.
Calculating the Yield Guarantee
The calculation of coverage percentage by the APH (Calculation 1) determines what the yield guarantee or “guaranteed bushels” will be in the event of a loss:
APH x Coverage Level (%) = Yield Guarantee (covered bushels)
|
Calculation 1: Yield Guarantee |
||
|
APH Yield (corn) |
Coverage Level (%) |
Yield Guarantee |
|
150 bushels |
75% |
112.5 bushels (150 x 0.75) |
A yield loss is then calculated by comparing your production in the insured year against the covered bushels. If the yield produced on your farm is lower than the covered bushels, you will receive an indemnity payment for the difference.
For this calculation to be accurate, USDA annually verifies your production through a yield report form. Your insurance agent will provide this form to you to complete. The yields reported must be as accurate as possible. If you are audited and the findings reveal inaccurate or false reporting of yields, sanctions against your policy and criminal or civil legal charges may be filed.
Review your records, especially sales receipts, and reconcile your production information after all grain is sold. You may have to wait until the next production reporting period to provide an updated yield depending on when sales occur. However, this is especially important if you discover actual yields were higher than reported, as this benefits your APH for future yield guarantees. If you find that actual yields are different than reported, contact your insurance agent to update your historical records.
You must have timely communication with your insurance agent about potential or realized losses. USDA RMA sets strict timelines that information must be reported to establish a loss has occurred. If a loss claim, or reporting of loss, is expected prior to harvest or shortly after harvest has concluded, contact your insurance agent as soon as possible.
Valuing the Yield Guarantee
Once the yield loss is established, the next consideration is how the bushels will be valued for an indemnity (loss) payment. To determine a payment amount, a price must be established for the bushels that were lost.
USDA’s RMA sets market elected prices for each covered crop based on information from the commodity futures market. The futures market sets prices for when commodities will be sold or traded in a specific period. This information is used to create the base price used in payment calculations. The base price is a universal price for all policy holders and is not based on an individual producer’s actual sales.
RMA tracks the closing dates of trading for corn and soybeans during the month of February. This is often called the period of discovery. It is used to estimate what the futures market is valuing the harvest price at during a specific point in the future. For corn, that point in time is December, while soybeans focus on the month of November. For wheat, the period of discovery is from August 15 through September 14 and the future point in time is the following September.
An average of the closing prices for each day during the period of discovery is calculated and set as the base price for that commodity. Once the base price is set, it is multiplied against the lost bushels to determine the value of an indemnity payment. It also influences the premium paid on the policy.
For more information on yield protection polices, visit the USDA RMA insurance plan website (https://www.rma.usda.gov/Policy-and-Procedure/Insurance-Plans/Yield-Protection-II).
Revenue Protection
Revenue protection policies have the same components as yield protection policies. The key difference is that they add protection against market price risk. The emphasis on price protection effectively changes the yield guarantee into a revenue guarantee (Calculation 2).
Yield Guarantee x Coverage Level (%) = Revenue Guarantee
|
Calculation 2: Revenue Guarantee |
||
|
Yield Guarantee (corn) |
Base Price |
Revenue Guarantee |
|
112.5 bushels (APH x Coverage Level) |
$3.50/bu. |
$393.75 (112.5 x $3.50) |
If the revenue received by the farm as calculated using futures market prices is lower than the revenue guarantee, the farm receives an indemnity payment. Because the guarantee is based on revenue, it addresses risk concerns for both yield and price. This offers coverage for three distinct scenarios for the farm business:
- If yields are low
- If market prices fall
- If a crop is short and market prices rise
Low yield coverage has already been covered in the “Yield Protection” section of this publication. To better understand the impact of falling or rising market prices, a more in-depth look into the prices used in revenue protection is required.
Base Price and Minimum Guarantee
While the yield guarantee uses the base price to value the bushels in an indemnity payment, revenue protection uses this same base price to establish the minimum guarantee. This is the lowest expected revenue that will be covered by the insurance policy. Since there is a minimum level for coverage, that means that coverage can also increase. An increase in coverage depends on the harvest price.
Harvest Price
The harvest price is an automatic option within the revenue protection policy. Just like the base price, the harvest price is set using the commodity futures market. The estimated value for the crop is based on the same time periods in the futures market as well: December for corn, November for soybeans, and September for wheat. The key difference is that the period of discovery changes to a month more in line with harvest periods. Instead of February, the period of discovery for December corn futures is during November. November futures for soybeans are tracked in October. For wheat, September futures are tracked in July.
An average of the closing prices for each day during the new period of discovery is then calculated. Once the harvest price is established, it is compared to the base price to determine if there is a difference.
If the harvest price is lower than the base price, the original revenue guarantee remains the same. The base price sets the minimum guarantee, so a lower harvest price does not affect your coverage. However, with revenue protection, the harvest price is also used to value the farm’s production. The lower value of production would theoretically mean that there should be less coverage. However, the minimum guarantee effectively acts as though your farm’s covered or guaranteed bushels have increased. This feature behaves as if a higher trigger yield exists to meet the minimum guarantee at the harvest price.
If the harvest price is higher than the base price, a new, higher revenue guarantee is set for the crop. The revenue guarantee effectively raises the lowest expected revenue for the farm and provides additional coverage. Since the harvest price is also used to value your farm’s production, the value of production has increased as well. This is the feature of revenue protection that protects your farm if you pre-harvest market (forward contract) any of your expected production.
Advantage of Revenue Protection
The addition of price coverage means that revenue protection policies offer several advantages over yield protection alone. With both price and yield being covered, revenue protection provides a greater chance that you will receive an indemnity payment. Those same indemnity payments may be larger than yield only protection policies. Revenue protection may also be competitively priced with yield only policies and can be used as an integral part of your marketing strategy.
These advantages can be seen in comparisons of yield and revenue protection policies in different pricing scenarios.
Let’s consider an example soybean farm that has an APH of 40 bushels per acre. In comparing the yield and revenue protection policies, the farm has selected a percentage coverage of 75%. After the discovery period, the base price was set at $11.87 per bushel. The yield guarantee would be 30 bushels (40 x 0.75) per acre while the revenue guarantee would be $356.10 per acre (30 x $11.87). An estimated poor harvest yield of 22 bushels is used to see how both insurance policies would protect the farm.
In Scenario 1, the discovery period for the harvest price yields the same price as the base price.
|
Scenario 1: Harvest Price is the Same as Base Price |
||
|
Soybean example |
Yield protection |
Revenue protection |
|
APH |
40 bu. per acre |
40 bu. per acre |
|
Coverage level |
75% |
75% |
|
Base price |
$11.87 per bu. |
$11.87 per bu. |
|
Guarantee |
30 bu. per acre |
$356.10 per acre |
|
Harvest yield |
22 bu. per acre |
22 bu. per acre |
|
Harvest price |
------- |
$11.87 per bu. |
|
New guarantee |
------- |
------- |
|
Indemnity |
$94.96 per acre |
$94.96 per acre |
In this situation, there is no discernable difference between revenue and yield protection policies. The yield protection policy values the eight-bushel difference (30–22=8 bushels) at $11.87 for an indemnity payment of $94.96 per acre.
The revenue policy has set a minimum guarantee of $356.10 per acre. The harvest production of 22 bushels is valued at the harvest price of $11.87 or $261.14. The production value is then subtracted from the minimum guarantee for an indemnity payment of $94.96 ($356.10 – $261.14 = $94.96).
In Scenario 2, the harvest price is found to be lower than the initial base price.
|
Scenario 2: Lower Harvest Price |
||
|
Soybean example |
Yield protection |
Revenue protection |
|
APH |
40 bu. per acre |
40 bu. per acre |
|
Coverage level |
75% |
75% |
|
Base price |
$11.87 per bu. |
$11.87 per bu. |
|
Guarantee |
30 bu. per acre |
$356.10 per acre |
|
Harvest yield |
22 bu. per acre |
22 bu. per acre |
|
Harvest price |
------- |
$10.75 per bu. |
|
New guarantee |
------- |
------- |
|
Indemnity |
$94.96 per acre |
$119.60 per acre |
In this situation, there is an advantage to the revenue protection policy. The harvest price is lower than the initial base price, so the minimum guarantee of $356.10 remains in place. However, the harvest price is used to value the farm’s production. The 22 bushels are multiplied by the harvest price of $10.75 for a production value of $236.50. When the production value is subtracted from the minimum guarantee, the indemnity payment is equal to $119.60 ($356.10 – $236.50 = $119.60).
The yield protection policy still uses the base price to value the yield loss. The indemnity payment remains at $94.96 per acre or $24.64 lower than the payment from revenue protection.
In Scenario 3, the harvest price is found to be higher than the initial base price.
|
Scenario 3: Higher Harvest Price |
||
|
Soybean example |
Yield protection |
Revenue protection |
|
APH |
40 bu. per acre |
40 bu. per acre |
|
Coverage level |
75% |
75% |
|
Base price |
$11.87 per bu. |
$11.87 per bu. |
|
Guarantee |
30 bu. per acre |
$356.10 per acre |
|
Harvest yield |
22 bu. per acre |
22 bu. per acre |
|
Harvest price |
------- |
$13.00 per bu. |
|
New guarantee |
------- |
$390.00 per acre |
|
Indemnity |
$94.96 per acre |
$104.00 per acre |
In this situation, there is an advantage to the revenue protection policy. The harvest price is found to be $13.00 per bushel, which is higher than the initial base price. The price increase establishes a new, higher revenue guarantee of $390 per acre ($13.00 x 30). The value of production is also increased. Using the harvest price, the production is valued at $286.00 ($13.00 x 22). When the production value is subtracted from the minimum guarantee, the indemnity payment is equal to $104.00 ($390.00 – $286.00 = $104.00). The yield protection policy still uses the base price to value the yield loss. The indemnity payment remains at $94.96 per acre or $9.04 lower than the payment from revenue protection.
Harvest Price Exclusion
Revenue protection does allow for exclusion of the harvest price. This option may be a favorable option in certain situations. The most common situations include:
- If you do not pre-harvest market
- If you are cost conscious
- If you are willing to take the drought-year risk of getting no or low payments
Excluding the harvest price is not a recommended option if you use pre-harvest marketing. First, the base price sets the final guarantee. Secondly, the harvest price is still used to value your farm’s production. This may result in a lower indemnity payment while still paying a higher premium compared to a yield protection policy.
Grain Marketing Strategies
One of the most difficult decisions for a farm manager is deciding how many bushels they should pre-harvest market. One concern is the potential for increased harvest prices. Higher prices could result in lost revenue opportunities. A second concern is if a shortfall occurs in production. If yields are lower than expected, there may not be enough bushels to fill a contract. Revenue protection provides some assurance to these concerns. It does so by offering guidance on how many bushels to comfortably market. The key is to focus on three areas within the policy:
- The farm’s APH
- The coverage level you elect
- The protection that is provided when harvest prices increase
Consider the same soybean example used in the previous scenarios. The farm has an APH of 40 bushels and has elected a coverage level of 75%. The farm planted 600 acres of soybeans this year. How many of the total anticipated bushels would be covered by insurance? The answer is 18,000 bushels (600 x 75% x 40). However, after the farm markets those bushels, August turns dry. This results in market prices increasing significantly. The production is poor, and the farm does not have the bushels to deliver on the contract. The price to purchase needed bushels is now higher than the contract price.
The farm is still covered in this scenario. The higher price is used to re-calculate and increase the final revenue guarantee. This insurance increase will offset the cost of buying the higher priced bushels needed to fill the outstanding contracts. Scenario 4 outlines this process.
|
Scenario 4: Revenue Protection With Low Yields and High Prices |
|
|
Marketed 18,000 bushels at $10.00 per bushel = |
$180,000 |
|
Only produce 13,200 bushels and must buy back 4,800 bushels at $11.40 per bushel |
–$54,720 |
|
Crop Insurance indemnity based off futures prices at $11.73 per bushel |
+$56,304 |
|
Gross return (after purchasing 4,800 bushels) |
$181,584 |
In the fourth scenario, the farm forward contracted 18,000 bushels for a gross revenue of $180,000. But it only produced 13,200 bushels. That means it needs to purchase 4,800 bushels. This purchase is at the higher market price of $11.40 per bushel. However, the final revenue guarantee is re-calculated using the futures price of $11.73 per bushel. After purchasing the bushels, the farm fills the contract, and its gross revenue is $181,584.
Remember that crop insurance policies will not always net a higher return as shown in the previous table. That’s because insurance policies are not meant to generate revenue, but to help manage against price and production risk. Managing risk is what keeps your farm in business and moving forward into the next year. The harvest price option allows you to reach your potential revenues by having confidence in your marketing strategies. Confidence in marketing is especially important in times of higher market prices. Using the harvest price option can help you lock in favorable prices while offsetting the concern of poor production.
Replant and Preventative Plant
Yield and revenue protection policies both have provisions for replant or preventative plant. These are standard options within each policy and provide additional coverage related to specific planting scenarios.
The replant option is used when a crop is lost, but an opportunity exists to replant it. This insurance policy assists in paying for expenses related to the crop’s replanting. Keep in mind that you are required to plant the same crop that was damaged to receive a replant payment. For more information on the replant policy, visit the USDA RMA website’s Frequently Asked Questions on Replanting (https://www.rma.usda.gov/News-Room/Frequently-Asked-Questions/Replanting-and-Final-Planting-Dates).
Preventative plant protects against situations where a crop cannot be planted. This insurance policy will offset pre-planting costs that were incurred up to the point of planting. There is an established final planting date and late planting period that must be exceeded to claim this option. These dates are important regarding what a producer can and cannot do to maintain eligibility for insurance benefits.
To figure a payment, a preventative plant factor is calculated to determine the pre-planting costs. The calculation uses fixed and variable costs based on state and national crop budgets. These costs can include large-expense items, such as machinery purchases and land rent. Variable costs can also be included, such as fertilizer, pesticide, labor, repairs, and even field preparation costs. You can find the preventative plant factor for your crop and county using the Actuarial Information Browser (https://legacy.rma.usda.gov/tools/).
The preventative plant factor is then multiplied by the amount of coverage you selected for the crop. Example 3 illustrates a scenario in Cass County, Michigan. The preventative plant factor for wheat is 60%. A farm in that county had selected 80% coverage on a yield of 75 bushels. They would have a preventative plant coverage of 60% on the yield guarantee or 36 bushels (60 x 0.60). If the base price is set at $5.00 per bushel, the indemnity payment would be $180 per acre (36 x $5.00).
|
Example 3. Preventative Plant Coverage on Wheat in Cass County |
|
|
APH Yield |
75 bushels |
|
Guarantee coverage level |
80% |
|
Market “base” price |
$5.00 per bushel |
|
Preventative plant factor |
60% |
|
Preventative Plant Coverage Calculation |
|
|
Guaranteed bushels |
60 bushels (0.80 x 75) |
|
Guarantee value ($$) |
$300 per acre (60 x $5.00) |
|
Preventative plant coverage |
60% |
|
Indemnity payment |
$180.00 per acre (0.60 x $300) |
To qualify for preventative plant, policy holders must meet what is called the “20/20” rule. The acres prevented from planting must be at least 20 acres or 20% of the insured crop for the unit to be paid, whichever is less. A new rule for Michigan, released in 2021, adds that the crop be planted, harvested, and insured in one of the last four years to qualify. This may be a point of concern for beginning farmers or new policy holders in their first year of being insured.
Additional preventative plant coverage of 5% can be purchased as an add-on to your insurance policy. If you are in an area with potential planting loss conditions, you may desire additional coverage for added coverage. For more information on the preventative plant policy, visit the USDA RMA website’s Frequently Asked Questions on Prevented Planting Coverage (https://www.rma.usda.gov/News-Room/Frequently-Asked-Questions/Prevented-Planting-Coverage).
Premiums and Subsidies
Crop insurance is not free and requires a premium be paid for its use. This applies to yield protection, revenue protection, and revenue protection with the harvest price exclusion. The premium for these policies will increase or decrease based on the crop units and the coverage level you elect for the insurance. Additional features, such as yield cups, will also increase the premium you pay for the insurance policy.
Despite the costs associated with crop insurance, know that premiums are highly subsidized by the USDA. Therefore, the premium you pay is not the full price for the insurance. These subsidies increase or decrease based on the unit and coverage level you elect as well. Table 1 highlights the current subsidies associated with enterprise units:
|
Table 1: Enterprise Unit Subsidy Rates |
||||||||
|
Coverage level |
50% |
55% |
60% |
65% |
70% |
75% |
80% |
85% |
|
Subsidy |
80% |
80% |
80% |
80% |
80% |
77% |
68% |
53% |
To be eligible for the subsidy, you must have the AD-1026 form filled out and on file at your local Farm Service Agency office. You can find a copy of the form at: https://www.farmers.gov/sites/default/files/documents/Form-AD1026-Highly-Erodible-Land.pdf
Additional Subsidy Support for Beginning Farmers
Beginning farmers receive an additional 10% or percentage points of premium subsidy toward existing coverage policy. The percentage points increase the subsidy and reduce the overall premium for the insurance. This applies to all insurance policies that have a subsidized premium through the USDA RMA.
For example, a farm in Eaton County has 100 acres of corn with an APH of 158 bushels of corn (Table 2). They elect to use enterprise units and a revenue protection policy of 85%. Their policy is subsidized at 53% (they pay 47% of total premium). A beginning farmer with the same policy would be subsidized at 63%, which translates to a substantial discount. The addition of the 10% or percentage points yields a $20.78 net premium. This is a difference of $5.61 per acre less than the non-BF (non-Beginning Farmer) premium calculation of $26.39.
|
Table 2: Effect of Beginning Farmer Subsidy on Insurance Premium |
||||
|
Policy Type: MPCI |
Plan/Share/Options |
Acres |
APH |
Net Premium/Acre |
|
Eaton County (Corn) |
RP-85% (EUPFQLTAYACCP) BF |
100 |
158 |
$20.78 |
|
Eaton County (Corn) |
RP-85% (EUPFQLTAYACCP) |
100 |
158 |
$26.39 |
(Note: BF=Beginning Farmer, RP=Revenue Protection)
Irrigation and Tiling Considerations
The use of irrigation or tiling are often considered alternatives to purchasing crop insurance. The money invested in a crop insurance premium could be used toward covering the cost of installing or maintaining irrigation or tiling systems. However, there is an opportunity to use these systems in addition to crop insurance for a more well-rounded risk management plan.
Irrigation primarily serves as a protection against drought. Tiling serves as a protection against excessive moisture. The questions to consider are how much risk these systems are mitigating for the farm and what risk remains unmanaged. Yield loss can still be affected by other natural causes, such as hail, wind, frost, insects, or diseases. Farm revenues can still be affected by price risk. Crop insurance, even at a lower coverage level, would still provide some assistance in the case of these additional risk factors. There would also be some level of assistance in replant and preventative plant scenarios that would not be covered by irrigation or tiling systems.
For example, a farm has traditionally used revenue protection with a coverage level of 80% on their corn field. They are mainly concerned about drought and recently installed an irrigation system. They determine that most of their risk has been mitigated. However, they still have concerns about other risk factors. They elect to keep their revenue protection policy but drop their coverage level to 50% on their irrigated fields. Any non-irrigated fields would remain at an 80% coverage level.
Using this coverage by practice option requires good production record keeping. Production for the irrigated acres within the unit must be tracked separately from the non-irrigated acres. If records are not available, production is combined or allocated, which could result in the loss claim being withdrawn.
SCO and ECO Policy Options
Two additional insurance programs can be used with an individual producer coverage policy: supplemental and enhanced coverage options.
You can use the supplemental coverage option (SCO) only if you have signed up for the Price Loss Coverage farm program administered through the USDA’s Farm Service Agency (FSA). Its coverage begins where your individual policy’s coverage level ends and will cover up to 86% of additional risk. For example, if your farm has a yield protection policy and a coverage level of 75%, the SCO option will provide additional county-based risk protection from 75% up to 86%. For more information on the SCO, visit the RMA’s factsheet on the program (https://www.rma.usda.gov/Fact-Sheets/National-Fact-Sheets/Supplemental-Coverage-Option-2018).
The enhanced coverage option (ECO) begins where the SCO policy ends. You can use it to cover up to 90% or 95% of additional county-based risk regardless of which farm program you choose to enroll in through USDA’s FSA. For more information on the ECO, visit the RMA’s factsheet on the program (https://www.rma.usda.gov/Fact-Sheets/National-Fact-Sheets/Enhanced-Coverage-Option).
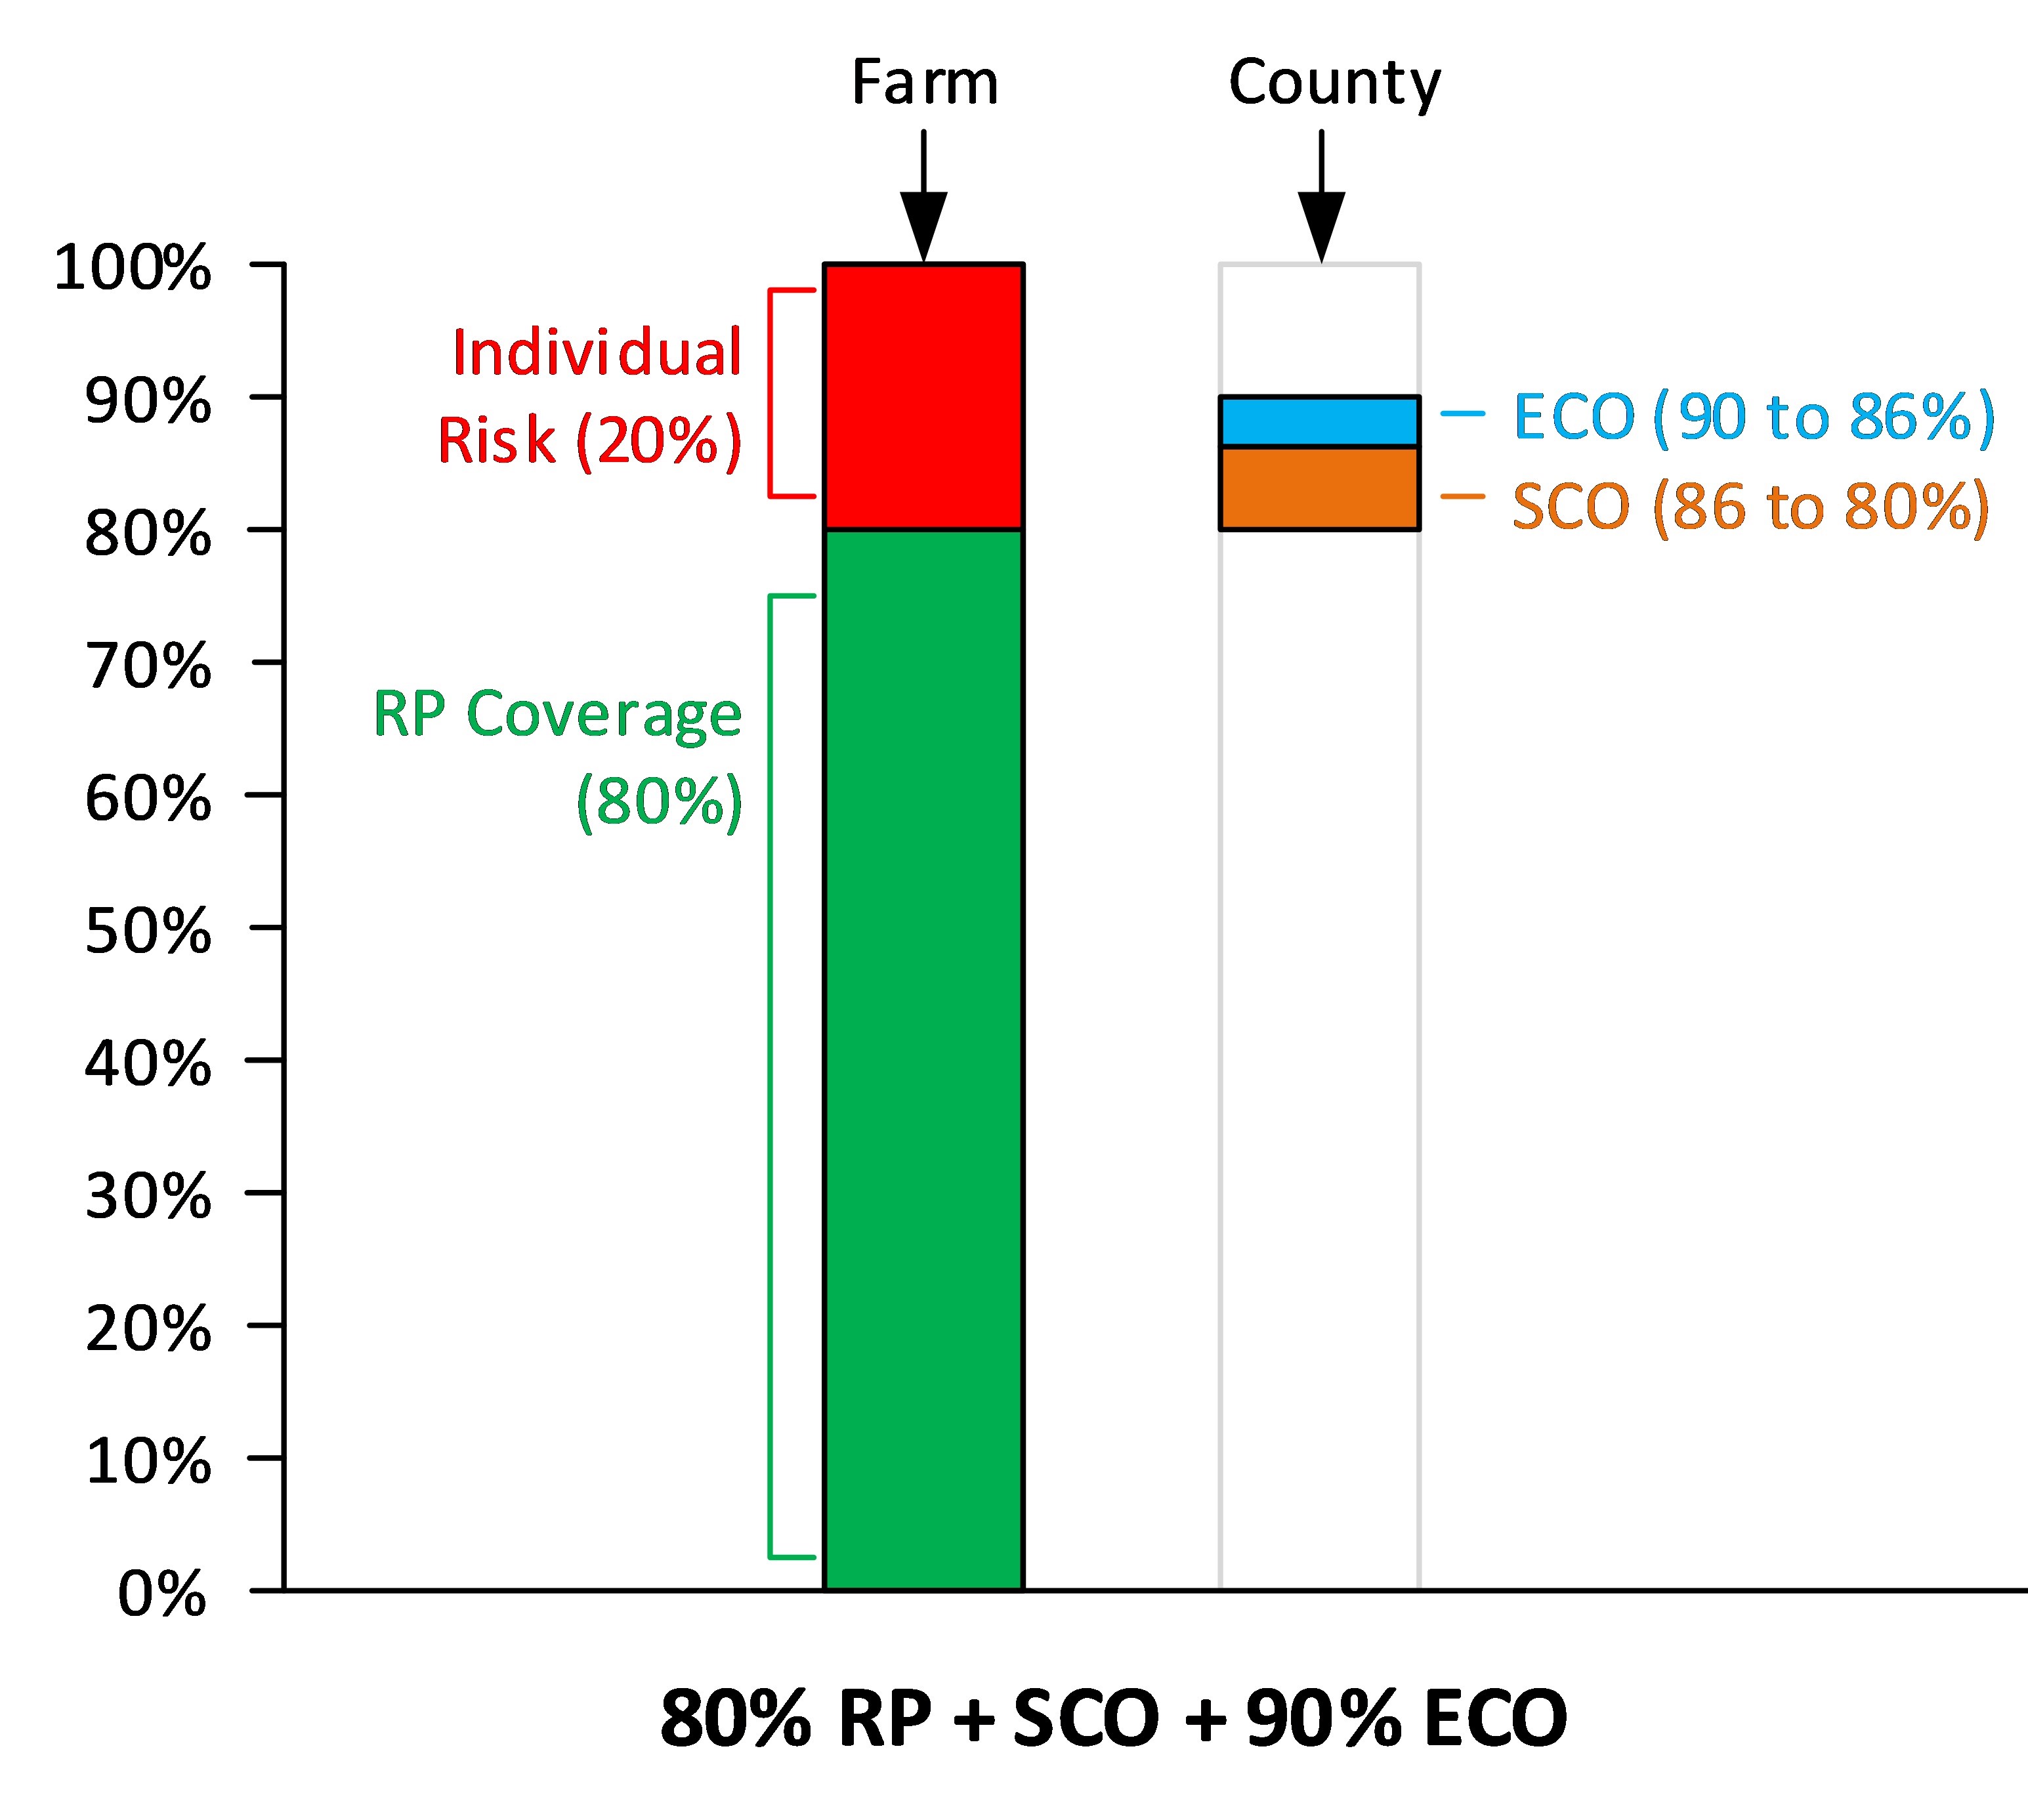
Figure 1. SCO and ECO are used in addition to individual coverage (yield protection – YP or revenue protection – RP). Source: Dr. Aleks Schaefer, Assistant Professor, Michigan State University Department of Agricultural, Food, and Resource Economics.
The key phrase for both programs is that they are county based. While they use your farms planted acres in an indemnity payment calculation, county-based yields are used in place of your farm’s APH. They mimic the underlying policy that you hold (yield or revenue) and use the same market prices to calculate an indemnity payment.
These programs effectively “stack” on top of your individual producer coverage, as illustrated by Figure 1. Both options have subsidized premiums like the individual producer coverage policies.
Crop Insurance Strategies
Michigan State University (MSU) Extension has found there are common strategies used with individual producer or area risk protection insurance policies. See Table 3 for a list of abbreviations of various policy options available to field crop growers.
|
Table 3: Policy Options and Their Abbreviations |
|
|
Abbreviation |
Policy |
|
ARP |
Area Revenue Protection |
|
ARPwHPE |
Area Revenue Protection with Harvest Price Exclusion |
|
AYP |
Area Yield Protection |
|
RP |
Revenue Protection |
|
RPwHPE |
Revenue Protection with Harvest Price Exclusion |
|
YP |
Yield Protection |
For individual producer coverage, revenue protection policies are used more often than any other insurance program for field crops.
As Figure 2 illustrates, for Ingham County, Michigan, revenue protection has held the largest percentage of insured acres since 2000.
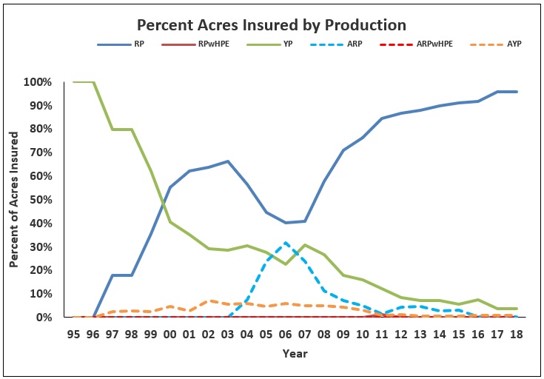
Figure 2: Percent Corn Acres Insured in Crop Insurance Programs, Ingham County, 2018. Source: University of Illinois Farmdoc Crop Insurance Decision Tool and Risk Management Agency, Summary of Business, December 2018.
Depending on the county and crop insured within Michigan, coverage levels range from 70% to 85%. Most policy holders also tend to choose enterprise units and the county-level trend adjustment for their APH. This is highly dependent on comparing the premium cost and guarantee to the farm’s cost of production.
For those producers who use the area risk protection insurance policy, the 90% coverage level is used most often. Individuals will then lower their protection factor to adjust the premium.
Recommendations
If you are planning to pre-harvest market your production, MSU Extension recommends the use of revenue protection. This would be appropriate for both individual producer and area risk protection insurance policy users. The added price protection provides not only opportunities to safeguard marketing opportunities, but helps to determine how much production to market.
MSU Extension highly recommends enterprise units, if eligible, where you can use them. If variability does exist, then optional units make the most sense, but be sure to consider the cost vs. benefit of the added premium. In many cases, the cost savings for an enterprise unit outweighs the advantages to optional units.
If the trend adjustment option to your individual APH is affordable and favorable, consider its use in your insurance policies. Coverage levels between 80% to 85% for most cropping situations often provide the best protection. However, there is often a significant increase in premium from 80% up to the 85% level. Consider the cost vs. benefit to your farm operation before electing for the higher coverage level.
Although not widely used, area risk protection insurance users will find 90% coverage typically offers the best coverage. The choice of whether to use a protection factor of 0.8 to 1.2 depends on each individual’s view on costs vs. benefits.
In addition to the policy options outlined in this publication, there are also private nonsubsidized (peril) policies on the market. The cost vs. benefit of these policies varies widely, but a crop insurance agent can help guide the decision of what is best for each individual farm.
MSU Extension recommends visiting with a crop insurance agent to discuss the policy options and risk scenarios that exist for your farm operation. Due to the number of details and options within crop insurance policies, deciding what to do can become complicated. There are also many insurance policies that overlap with USDA FSA programs (such as SCO and ECO). A strong working relationship with your agent can be very helpful when it comes to record keeping, program analysis, and program rollout notifications. Agents can provide specific details on eligibility, timelines, and documentation requirements for policies and options of interest. If you plan to pre-harvest market, they can also help ensure your insurance policies match with your marketing strategies. To visit with a crop insurance agent, use the Agent Locator Page offered through the USDA’s RMA (https://www.rma.usda.gov/Information-Tools/Agent-Locator-Page).