When is the Best Time to Sell Grain?
DOWNLOADApril 30, 2025 - Jonathan LaPorte
 Print
Print Email
EmailOne of the challenges with successfully marketing grain is identifying the best time to sell. Market prices can change frequently based on supply or demand which creates uncertainty about when to sell. Selling too soon can mean missing opportunities for higher prices. Selling too late can lead to concerns about minimizing losses if prices suddenly go down. Global supply and trade disruptions, or even potential disruptions, can also add additional uncertainty to markets. To navigate this challenge, a review of recent market trends may offer some guidance on opportunities to maximize grain sales. Market trends reveal that a theoretical “typical” marketing trend may not always be present in any given year. Additionally, the best time to sell corn may not be the best time to sell soybeans. Especially considering impacts from competitors in the global market.
Historical Market Trends for Corn and Soybeans
Market trends focus on the overall movement of prices during a given period. Seasonal periods of low supply or high demand are often used as a guide for what to expect in a typical trend. In a typical year, an ample supply of corn exists at harvest time. Higher supply often means that prices will begin to decline at and through the harvest period. Supply inventory and use both help determine prices in the months leading to planting. Demand picks up as supply goes down and prices begin to increase.
Unfortunately, markets and price directions don’t always follow typical trends, especially when disruptions occur in supply or demand. The past decade of market trends highlights these effects, with periods of stability and volatility affecting price direction. More volatility has existed since global supplies of grain and inputs saw significant shifts in 2020. Initially, input and grain prices were driven up by reductions in their respective supplies. Some of the reductions were due to Covid-related supply chain disruptions, reduced production, and global trade. The net effect was higher commodity demands until global supplies began to rebalance in late 2022/early 2023.
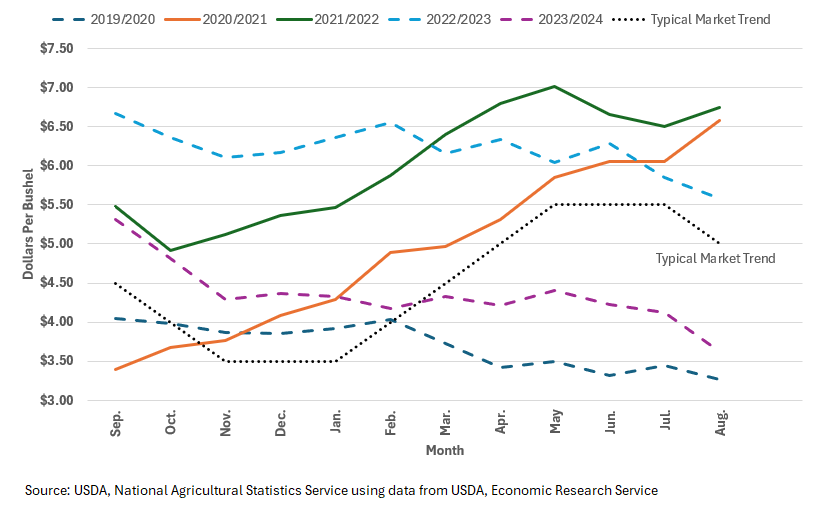
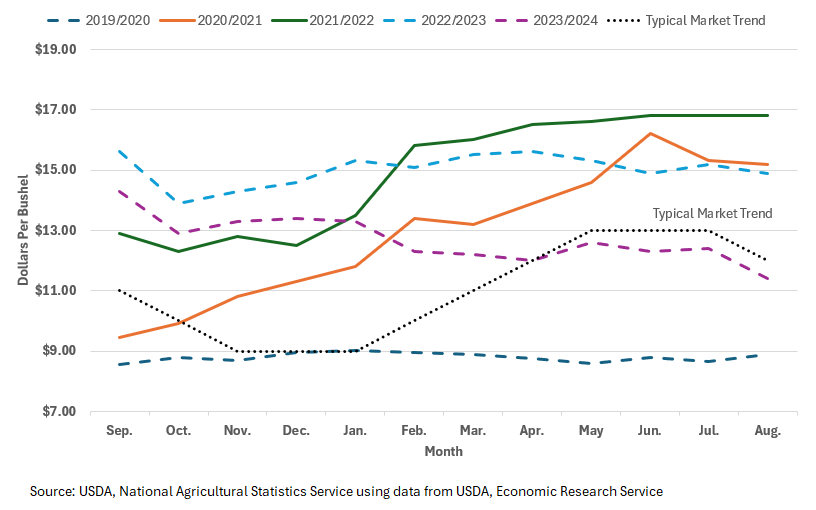
Figure 1 illustrates how the volatility experienced in Michigan corn markets from 2019 through 2023 led to quite a few non-typical market trends. A theoretical “typical” market trend is included in the chart for illustrative purposes. Only 2020 and 2021 had trends that were similar to a “typical” year. Similar information was also seen for Michigan soybean growers, with only 2020 and 2021 having trends similar to a “typical” marketing year (Figure 2).
As the charts outline, recent market trends by themselves may not seem to offer much guidance at first glance. However, even in times of volatility, the information behind the trends may still provide helpful information, especially as producers consider establishing decision deadlines in their marketing plans.
A Word on Decision Deadlines
The goal of grain marketing is to sell each year’s grain production and maximize revenues. Decision deadlines are key dates within your marketing plan to ensure you are intentional towards achieving desired market goals. These dates are not pre-set “sell-by” periods when you have to make a sale. Instead, they are meant to encourage you to review your strategies and adapt to market conditions before finalizing a sale.
Decision deadlines go hand-in-hand with setting price targets for each sale of grain. If current prices don’t meet your price target at a decision deadline, evaluate the current trends in the market. If higher price opportunities are expected, it may be advantageous to hold off selling until a later date. If prices are low and may get lower, selling at the decision deadline to minimize losses may be the correct strategy. Having dates within your plan helps you to be proactive about decision-making by reviewing market conditions and potential options.
|
Example Scenario It’s late February and Farmer Kayla has a hedge-to-arrive contract on 5,000 bushels of corn. The contract is for March delivery with a Futures price of $4.25 per bushel price. The basis is not set on the contract. She wants to net a cash price of $4.10 per bushel. Basis is currently -$0.25 under the Futures price or a cash price of $4.00. She has the option to roll the contract and deliver in April for a fee of $0.01 per bushel. She prefers to sell the corn in March and only focus on planting soybeans in April. But market reports indicate there’s a chance basis could significantly increase in April. The increase could be enough to cover the fee to roll the contract and storage costs. Farmer Kayla sets a decision deadline of March 20 to review basis trends and to choose an option:
|
Data Behind the Trends (Corn)
The past decade has seen a period of stability followed by a period of uncertainty existing in the corn markets. To set decision deadlines with this information, it’s important to understand your marketing strategies and identify common patterns to optimize them. For example, storing corn may be part of several marketing strategies you are considering. Are there periods when prices are commonly at their highest to help guide potential sales dates of your stored corn?
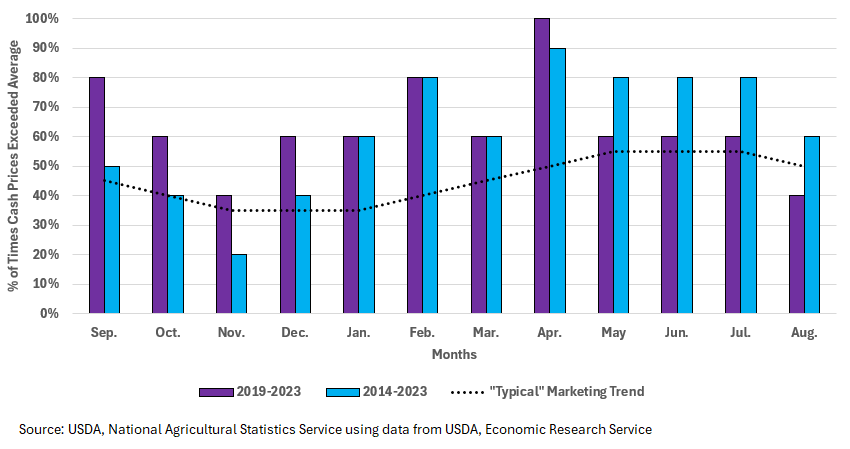
One way to identify optimal decision deadlines is to compare cash prices received against a market-year average price. The market-year average price is based on the total cash sales received by farm producers during the marketing year. Figure 3 covers the period of corn prices in Michigan from 2014-2023 and the more recent period of 2019-2023 cut out in a side-by-side view. The chart illustrates how many times during the period that monthly corn prices were above the market-year average price for Michigan. An example of a typical marketing trend curve is also included for illustrative purposes.
In the 10-year period (blue bars), a pattern mirroring the typical marketing trend is readily seen from September through February. Cash prices exceed the market-year average price fewer times entering the harvest period. During harvest, peak months appear to be October and December, with lower prices in November. After harvest, the frequency of cash prices exceeding the market-year average price begins to steadily rise. January prices exceed the average 60% of the time before increasing to 80% in February. The trend deviates in March when the number of times prices exceeded the average dipped down to 60%. April saw a significant climb to 90% before prices settled at 80% of the time from May to July.
The same pattern is seen in the 5-year period (purple bars) until the month of April when all five years saw prices that exceed the market-year average price. Prices then settled at levels above the market-year average price, 60% of the time from May through July.
Data Behind the Trends (Soybeans)
The pursuit of common patterns also helps when seeking guidance on optimal selling periods for soybeans. Especially since soybean markets saw similar periods of stability and uncertainty as described for corn markets.

Soybeans also revealed common patterns when comparing how often monthly cash prices received exceeded the market-year average price. Figure 4 illustrates that in the 10-year period (blue bars) soybean prices during harvest tend to exceed the market-year average prices more often during December (30%). Post-harvest prices exceed the average more often during the months of January through March (70% frequency). Cash prices then decline (60% of the time) in April and May. Prices decreased to 50% of the time above the market-year average price before increasing to 80% in July. The 5-year period (purple bars) offered a similar pattern with a slightly higher frequency (80%) in January through March. Prices that exceeded the market-year average price leveled out at 60% of the time from April through May.
Both the 10-year and 5-year periods offer a pattern different compared to corn. The data suggests that peak sale opportunities for soybeans may exist slightly earlier than corn. Often corn and soybeans are treated like mirror images of each other and have similar trend expectations. These expectations are due to how correlated the crops are in planting rotation and pricing comparisons. However, the observation that peak sale for soybeans occurs earlier is supported when considering the export timing of competing countries, such as Brazil.
Influence of Brazil Exports
Brazil is the leading country for soybean exports and a major competitor for U.S. soybean markets. According to data from USDA’s Economic Research Service, almost 85% of Brazil’s soybeans are exported annually compared to 49% of U.S. soybean production. Further data from USDA’s Foreign Agricultural Service indicates that sales opportunities may exist based on when exports occur.
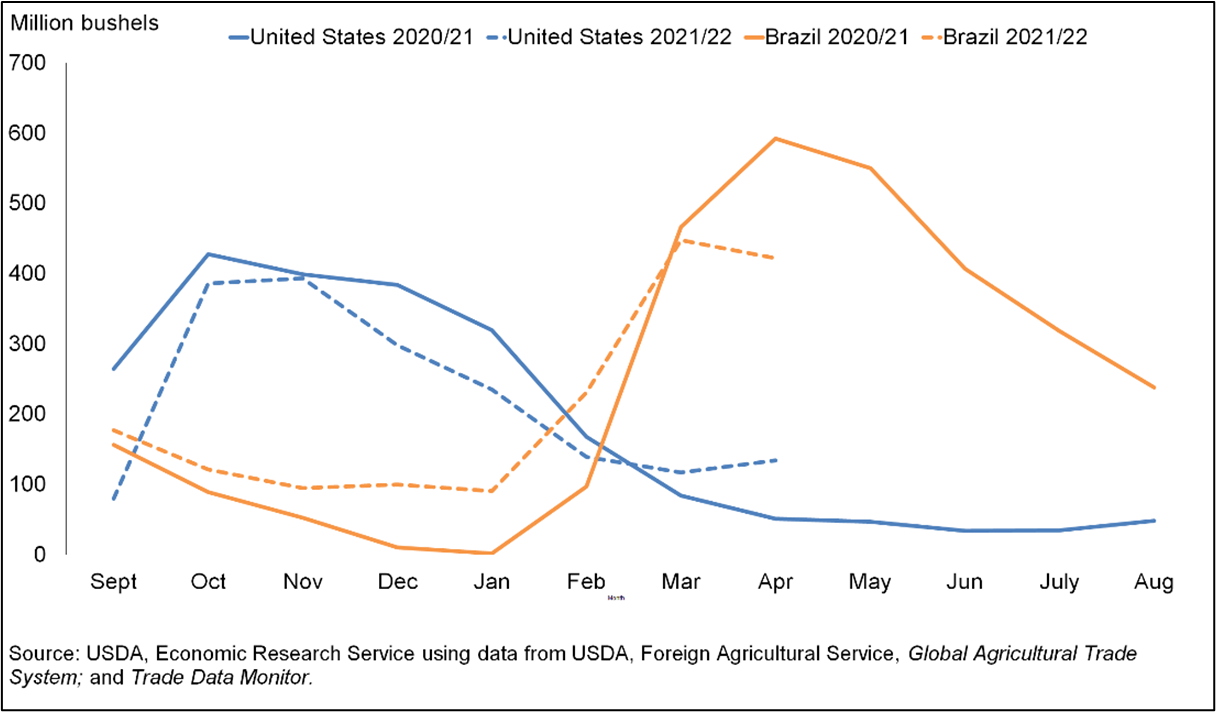
Figure 5 provides the timeline of exports between U.S. and Brazil from 2020 and part of 2021. The chart highlights that most of the U.S. exports occur between September through November before trailing off in December. Brazil’s exports begin to increase in February but don’t reach peak levels until March through May. This creates a window between January and March that correlates with higher historical cash prices received in Figure 4. This indicates that potential opportunities for sales exist during this period and provides a good timeline for when to target decision deadlines.
Making Use of Market Trend Data
Market data indicates that the best opportunities often exist outside of harvest months. In particular, February and April are historically peak months for corn sales, while January through March are peak months for soybean sales. Market plans should include decision deadlines that align with historically peak sales opportunities. These deadlines should only be used as a guide and not pre-set “sell-by” dates for sales.
At the same time, market data also supports that opportunities to maximize potential prices may exist outside of peak months. This is especially true if disruptions to supply and demand are creating volatility and uncertainty in a particular marketing year. Staying up to date on current market news and trends is important as you approach decision deadlines. You can also reduce the risk of uncertainty by aligning your decision deadlines with a wide range of marketing strategies (https://www.canr.msu.edu/news/price-checking-your-grain-market-strategies).
Other reasons to consider some sales outside of peak months may be to address cash flow needs, income tax management, or storage limitations. Be sure to plan for end-of-year cash flow needs by setting decision deadlines ahead of payment dates. Local basis trends may also be a key factor that favors some sales at-harvest. October and December are historically key “at-harvest” months for optimum corn and soybean sales.
As you begin the process of creating your marketing plans, it is important to remember that markets do not operate in absolutes. As illustrated in the past five years, a typical market trend is not guaranteed each year. The presence of uncertainty or disruptions to supply and demand can dramatically shift price directions. Sometimes this can occur on a monthly, weekly, or even daily basis.
Overall, the best time to sell grain will be dependent on yearly market conditions. However, using these approaches to compare market conditions with historical market trend data will allow you to gauge potential sales opportunities. Most importantly, they will help you remain intentional and proactive towards achieving your market goals throughout the season.