


Frequently Asked Questions (FAQs)
What does it mean if an industry in my county is above predicted or below predicted values?
If your county appears as “above predicted”, there are more establishments (business locations) of that industry in your county than would be predicted based on your population characteristics. For example, if your population would suggest you have two pharmacies, but federal data show 4 pharmacy establishments in your county, your county would appear as “above predicted.” See the discussion questions above to consider the implications of these designations.
Why are predicted values decimals and not a whole number?
The predicted values in the tool come from a statistical model that estimates the number of businesses expected in a community based on community demographics, financial information and place variables. Community data often suggests a level of demand that supports part of a business rather than a whole number. For example, community variables may predict “half a business.” This is useful because you can combine that estimate with other information you know about your county (e.g., trends, location of activity) that can help you think about business potential. You may be less inclined to consider starting a new business if the predicted value is 0.5 than 0.9. If we only predicted whole numbers, both 0.5 and 0.9 would appear as 1, and valuable information would be lost. You may also be able to think about what business types could be combined to meet local needs. Might there be an opportunity for a sporting goods and clothing store combo? To learn more about the statistical methodology and variables behind the Economic Opportunity Maps, visit our Methodology webpage.
What model and information is used to predict the number of establishments?
The statistical model underlying the Economic Opportunity maps relies on restricted access establishment from Federal Statistical Research Data Centers (FSRDC). The Longitudinal Business Database (LBD) Integrated Longitudinal Business Database (ILBD) data provide exact counts of establishments and employment by year. To protect the privacy of individual businesses, we are prohibited from publishing these exact counts. Therefore, our team models the expected establishment count using a zero inflated Poisson log-likelihood function. First, the zero-inflation stage of the model distinguishes structural zeros – locations never chosen for an industry – from sampling zeros – locations that could potentially be chosen or were chosen in the past but are not currently occupied. Then the amount stage of the model predicts the number of establishments if a location exhibits potential for a given industry. To learn more about the statistical methodology behind the Economic Opportunity Maps, visit our Methodology webpage.
What does the grey * mean?
A county colored grey means that the data for the county is missing. This is very rare.
I can think of more businesses in an industry than the Economic Opportunity Mapping tool counts. How is that possible?
Data are from 2014, and the number of establishments may have changed. Establishments report their industry classification, and they may report under a different code. For example, a liquor store may report as a convenience store, or a pharmacy may be part of a grocery store. Can you think of other ways businesses in your industry of interest may classify themselves?
Conversely, why does the Economic Opportunity Mapping tool counts more businesses than I can identify for a certain industry?
Business Patterns data report only establishments with paid employees. Self-employed individuals are not included in this data. While most businesses with more than one location provide data for individual establishments, not all small businesses report each establishment separately. Other establishments excluded from the Business Patterns data are businesses without an Employer Identification Number, employees of private households, railroad employees, agricultural production employees, and most government employees. number of establishments may have changed over time.¹
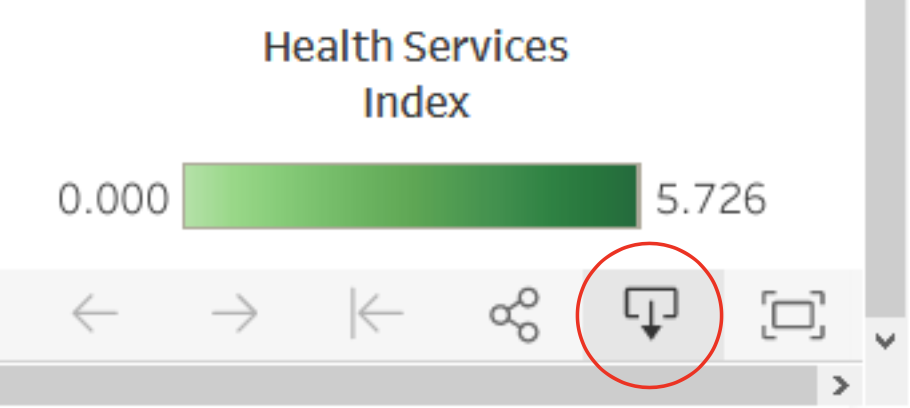
Can I download these data?
The map data are downloadable using a link on the lower-right corner of the embedded map. Data can be exported in several formats. If you select data, you can highlight and copy the data rows and paste them into Excel.
Where can I find additional data on businesses in my region?
You can compare the data in this mapping tool with County Business Patterns data at https://data.census.gov/cedsci/. However, data in smaller counties often suffers from disclosure issues, and you may encounter a symbol suggesting a range of establishments, employments, and payroll. In addition to Business Patterns data, you may search Non-employer Statistics at the same website for establishments that do not have employees. This video provides a brief tutorial on accessing the County Business Patterns data from the Census Bureau Website.
How do you measure social capital?
We use a social capital index developed by Rupasingha, Goetz, and Freshwater. This index is based on an array of individual and community factors that are theoretically important determinants of social capital. Details can be found here: Rupasingha, A., Goetz, S. J., & Freshwater, D. (2006, with updates). The production of social capital in US counties. Journal of Socio-Economics, 35, 83-101. doi:10.1016/j.socec.2005.11.001.
This data is great! Now what do I do with it? How can I help strengthen my county economy?
We hoped you’d ask. See our Suggestions on How to Use the EOM Tool webpage for tips and tools to start a conversation about economic development and set an action plan for the future.
Questions or Comments?
Craig Carpenter, Ph.D.
Assistant Professor and Extension Specialist
Texas A&M Agrilife Extension Service
Michigan State University Extension
carpe224@msu.edu
Anders Van Sandt, Ph.D.
Assistant Professor and Extension Specialist
University of Wyoming Extension
avansand@uwyo.edu
Scott Loveridge, Ph.D.
Professor and Extension Specialist
Michigan State University Extension
loverid2@msu.edu
Rebekka Dudensing, Ph.D.
Associate Professor and Extension Economist
Texas A&M Agrilife Extension Service
rmdudensing@tamu.edu
Linda Niehm, Ph.D.
Professor
Iowa State University Extension and Outreach
niehmlin@iastate.edu
This project was supported by the Agricultural and Food Research Initiative Competitive Program of the USDA National Institute of Food and Agriculture (NIFA), award number 2017- 67023-26242.
 Print
Print Email
Email