


User Guide
Welcome!
An Economic Opportunity Map (EOM) is a unique way for individuals to interactively explore business opportunities in their county across various industries.
This document guides readers through the mapping tool itself as well as elements of each EOM. We will begin by considering the different types of industries represented across these EOMs followed by a more detailed look at the EOM interactive mapping dashboard. Finally, we will point out some additional tools to assist users in interpretations and guiding discussion.
To start, you can find the EOMs by clicking here: https://www.canr.msu.edu/economic_development/economic-opportunity-maps/, or by copy and pasting this address into your internet browser.
Thank you,
-The EOM Research Team
Selecting Industries of Interest
 Once you navigate to the EOM website, you should see an introduction describing the maps. Scrolling down, you will see a long list of industries categorized into their larger economic sectors. Each of these industries have EOMs available for you to click on and begin exploring.
Don’t see an industry you are looking for? Unfortunately, we are limited in the number and types of industries that can be mapped using our data statistical techniques. For more information on your industry of interest, reach out to one of our team members or contact your local economic development Extension specialist or educator.
The Mapping Dashboard
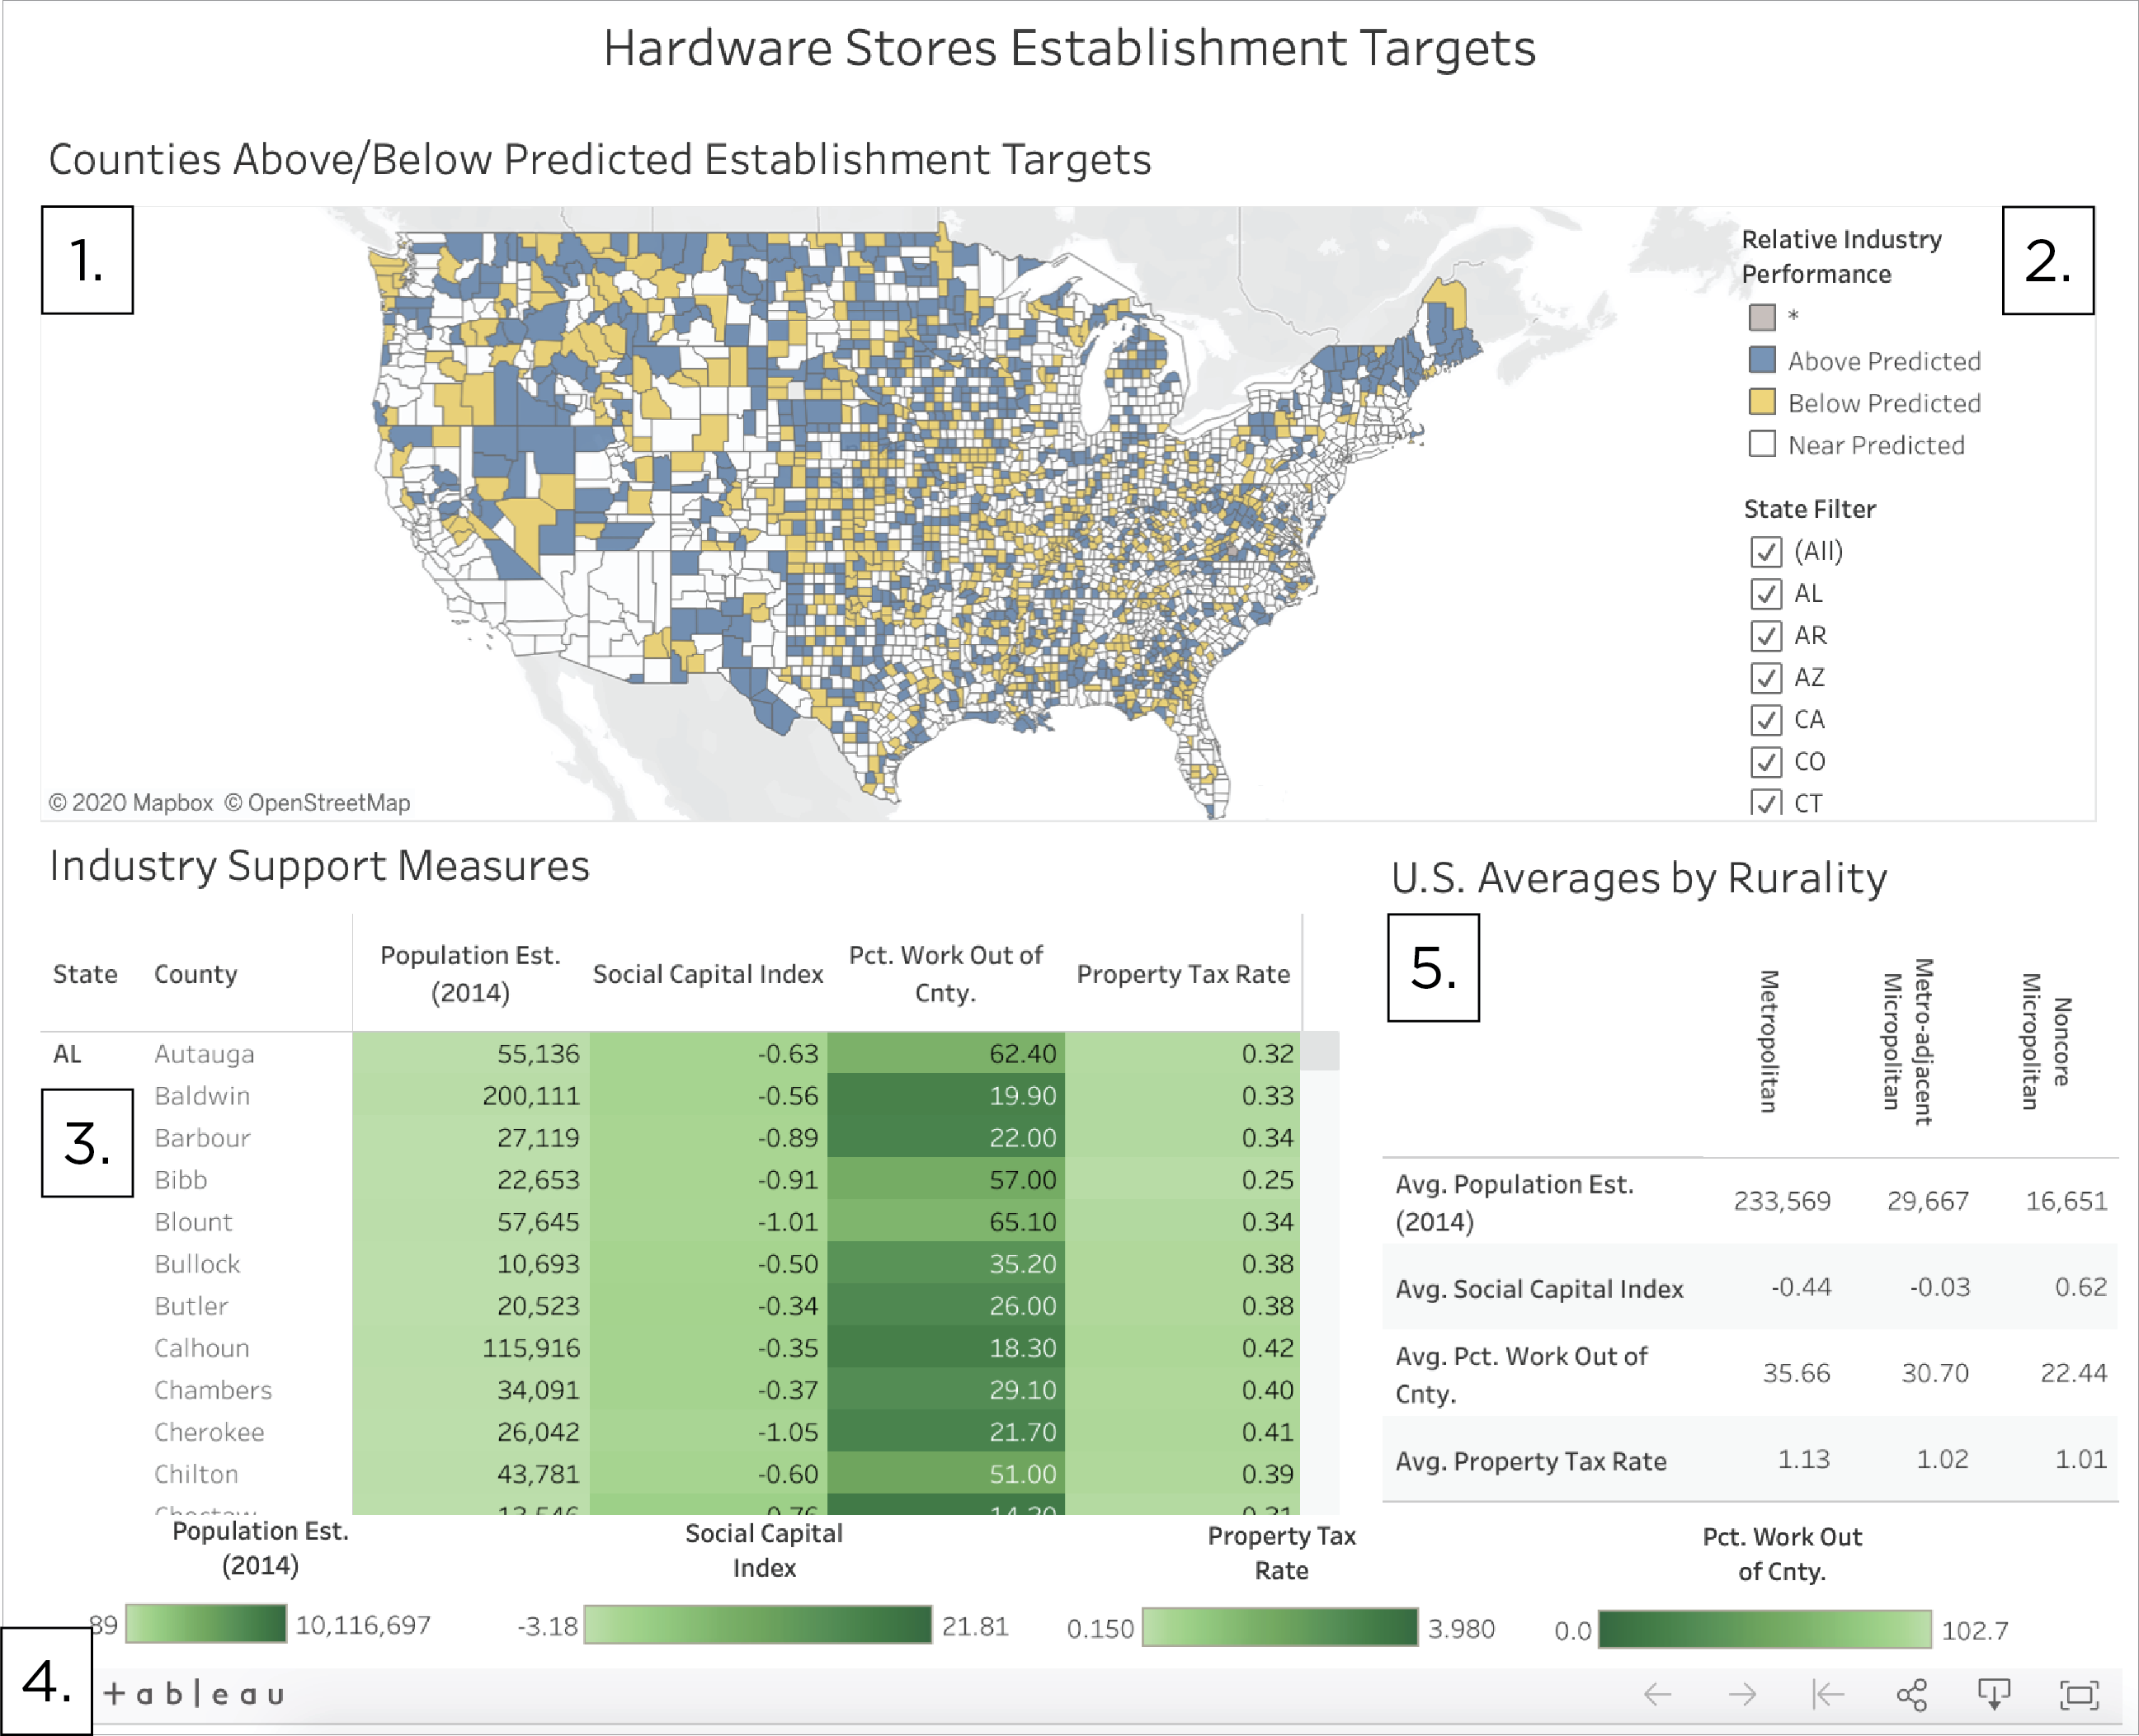 After you select your industry of interest, you should see something like the image to the right. This particular map looks at Hardware Stores, a retail sector industry, but regardless of the industry, you should see these four elements:
- The Map
- Map Legend
- County Table
- Table Legend
- Rurality Table
We will now focus in on the five elements of the EOM tool.
The Mapping Dashboard: 1. The Map
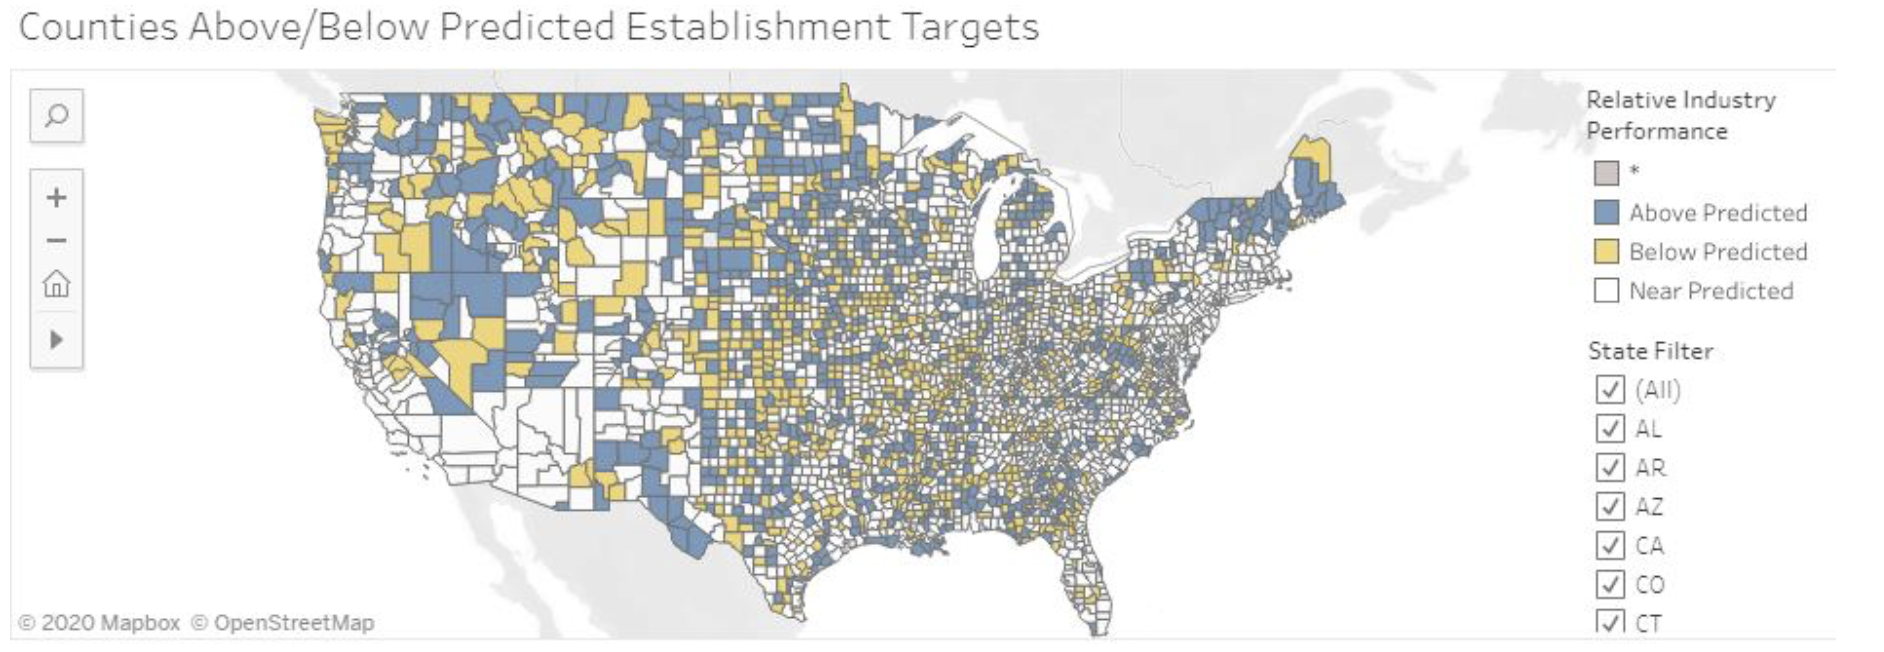
The map is the main tool you will use to explore economic opportunities in the industry you selected. These county-level maps of the U.S. show counties with more establishments than predicted (blue), counties with fewer establishments than predicted (yellow), and counties with establishments near the predicted value. Grey counties represent those without available data.
So what does this all mean? Well, if a county is “Above Predicted” (blue), then there are more establishments in that industry than our economic model predicted. This could suggest one of the following scenarios: the industry is exceeding our expectations and doing well in this county, the industry is acting as a larger regional industry serving the neighboring counties, or the industry is overdeveloped for the local market and at risk of shrinking. The true scenario can only be identified after you apply your on-the-ground knowledge of that place. Similarly, yellow counties indicate there are fewer establishments than our model predicted. This could suggest one of the following scenarios: the industry is facing local barriers preventing development, demand in the county is being pulled away from the same industry in another county, or the county has just not yet realized the potential for growth in this industry.
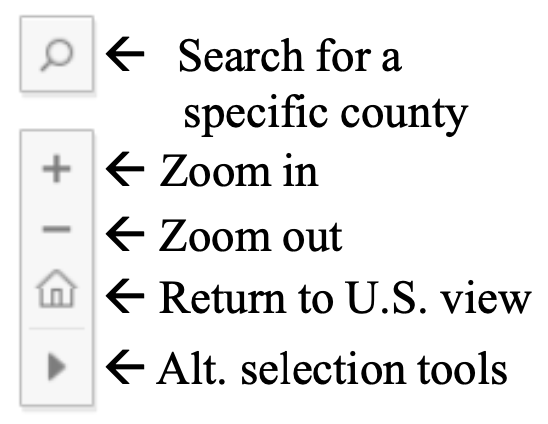 In the top left corner of the map you will see a navigation toolbar that will help you search for a particular county, zoom in, zoom out, return you to the U.S. view, or give you different selection tools. You may also be able zoom in or out using the scroll toggle on your mouse if you have one.
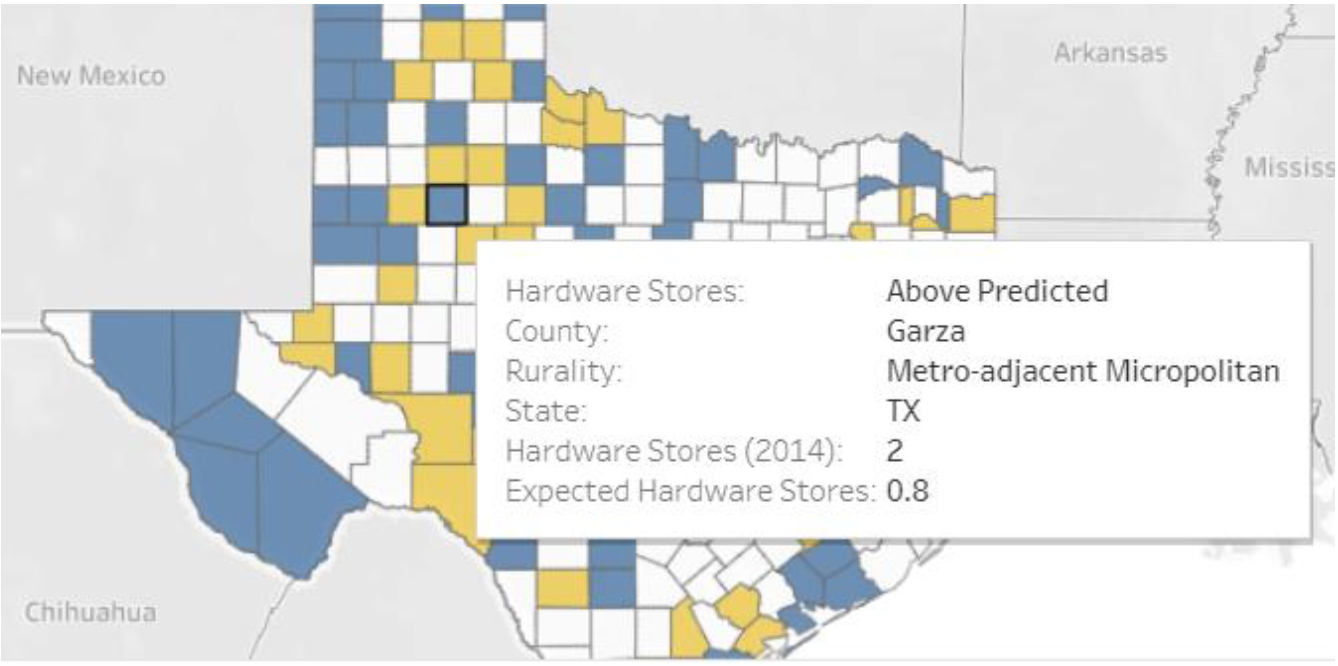 Hovering your cursor over a county brings up a box describing the county. The image to the left shows us that the county our cursor is on is “Above Predicted,” named Garza County, is a Metro-adjacent Micropolitan county, is in Texas, and in 2014 had two hardware stores where we only expected to see 0.8 (or 1) hardware store establishment.
 For users interested in counties along a state boarder or those interested in a county’s sub state region, it may be helpful to consider an alternative county selection rather than using the State Filter. The alternative selection tools at the bottom of the map navigation toolbar provides tools to assist users in exploring non-state county selections.
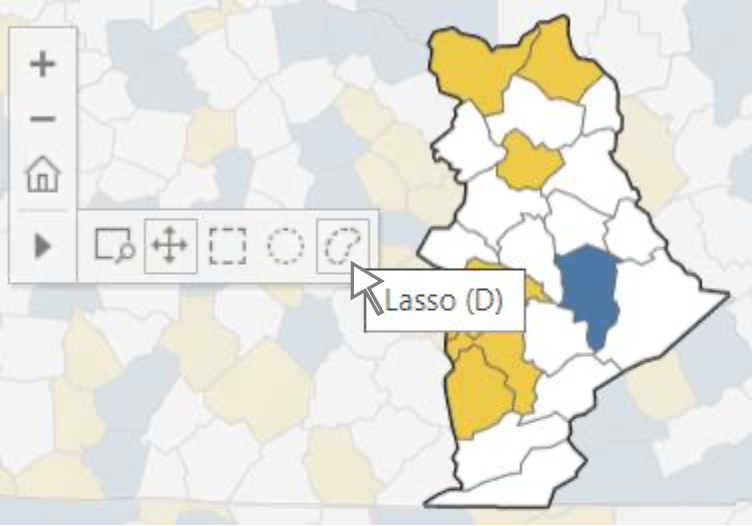
For example, in the image on the right, we use the Lasso tool within the alternative selection tools to focus on just the counties in Eastern Kentucky. We might want to look at this region of Kentucky in the Appalachian Mountains because it has markedly lower incomes and different economic development challenges compared to the rest of Kentucky. Whereas the Lasso tool is useful for these irregular shaped regions, the Rectangle and Radial tools may be better for looking at a selection of counties centered on a specific county of interest (acounty’s “neighborhood”). The other two tools can be used to zoom in on an area or to pan around the map by clicking and dragging.
The Mapping Dashboard: 2. Map Legend
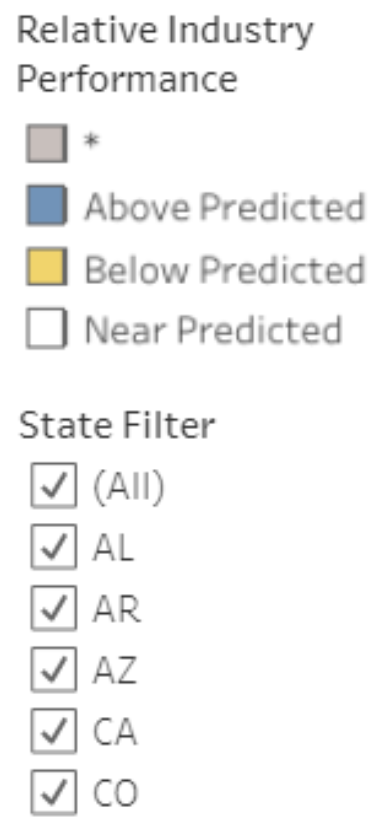 In the top right corner of the map you will find the map legend. The legend not only reminds you what each county color means, but it can also be used to select subsets of counties you are interested in. Clicking on the “Above Predicted,” “Below Predicted,” and “Near Predicted” boxes in the legend will cause the map to highlight just the counties that fit that description. Similarly, the state filter can be used to focus on one or a group of states. The default is all states. Clicking the box next to (All) will clear the whole map enabling you to then select your states of interest by clicking on the boxes next to them.
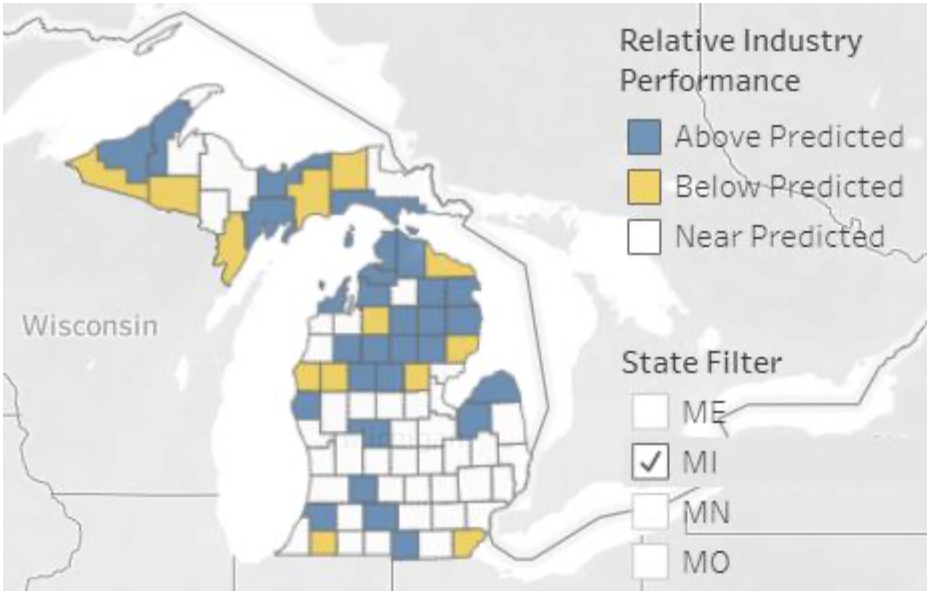 The image to the left shows the State Filter in action. We cleared all states by deselecting “(All)” and then selected just Michigan. This greys-out all other states enabling us to focus on just the counties in the state we are interested in. We can then select one of the Relative Industry Performance measures to further narrow our focus.
The Mapping Dashboard: 3. County Table
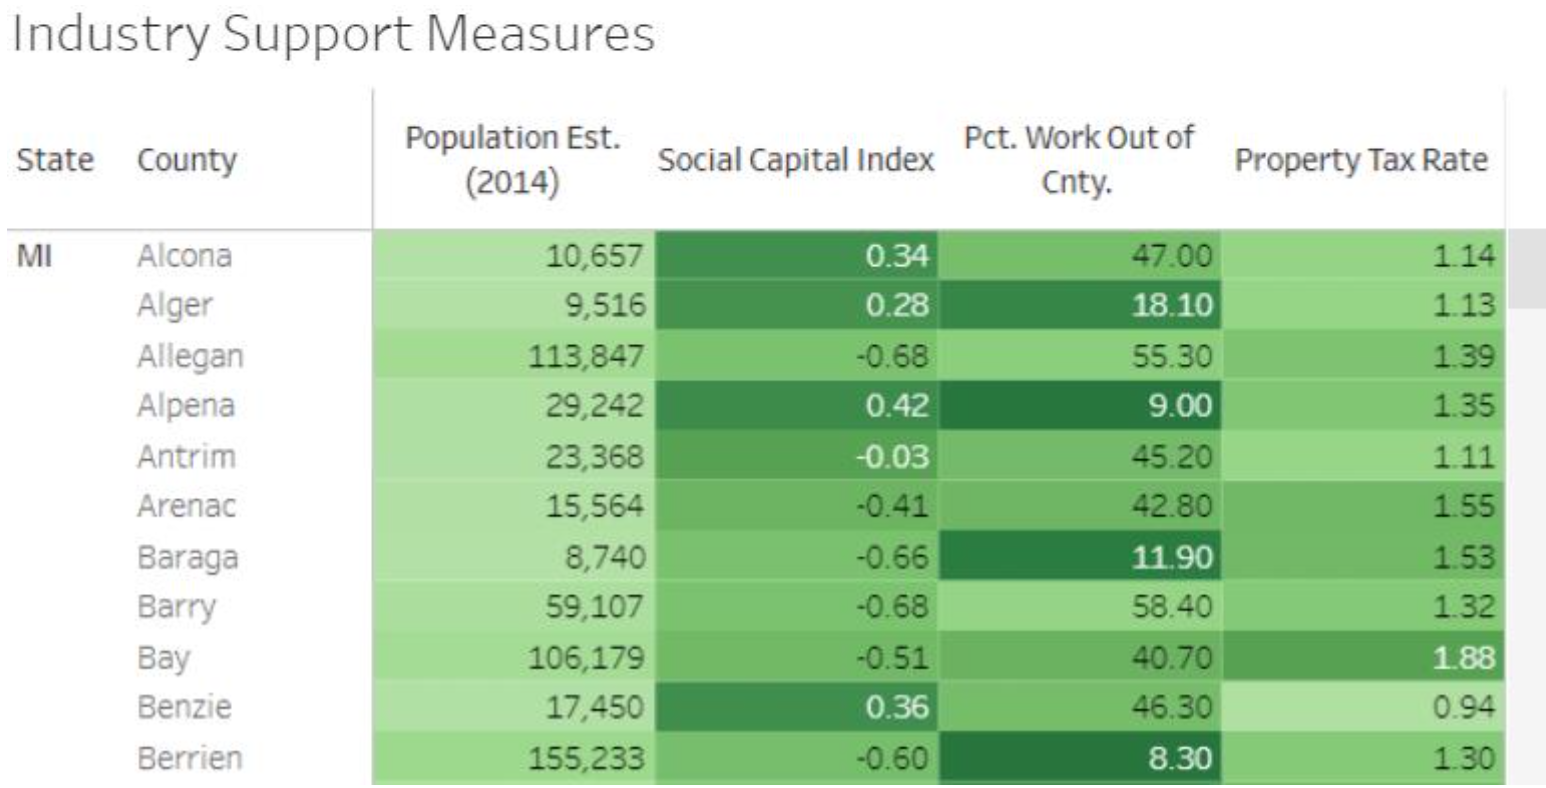 The County Table shows four Industry Support Measures for the counties you selected through the map or State Filter. We kept our previous selection of just Michigan counties in the image below to show how the table updates based on your selection. Not all industries are alike, so the four Industry Support Measures in the County Table differ depending on the industry you select. The observed Industry Support Measures are selected based on the variables that had the largest and most likely impact on the industry. Here, it appears a county’s population, social capital, percent of residents who work out of county, and the aggregate local property tax rate had the largest influence on hardware store locations.
The Mapping Dashboard: 4. County Table Legend
The County Table Legend is located at the bottom of the Mapping Dashboard.

The County Table Legend items shown will depend on the Industry Support Measures included for the industry you are exploring. Note sometimes the darker shade is on the right of an Industry Support Measure’s scale, and sometimes it is on the left. This is because light/dark do not mean more/less, but rather “better”/“worse” for industry growth. For example, more population leads to more hardware stores, so higher levels of population are darker (better). Alternatively, fewer residents commuting outside the county for work leads to more hardware stores, so the lower values of Pct. Work Out of County are darker (better). Note this shading scheme is also present in the County Table to give the user an indication if a measure’s value in a specific county is relatively better or worse than the other counties in the user’s county selection.
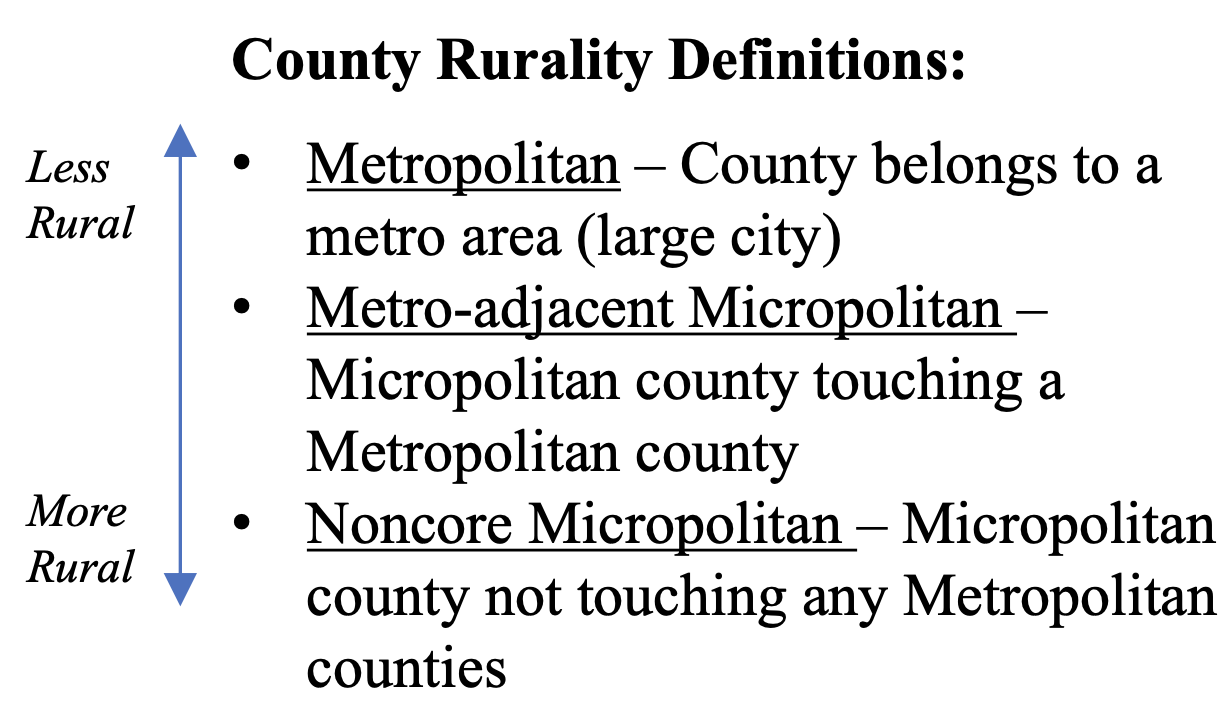
The Mapping Dashboard: 5. Rurality Table
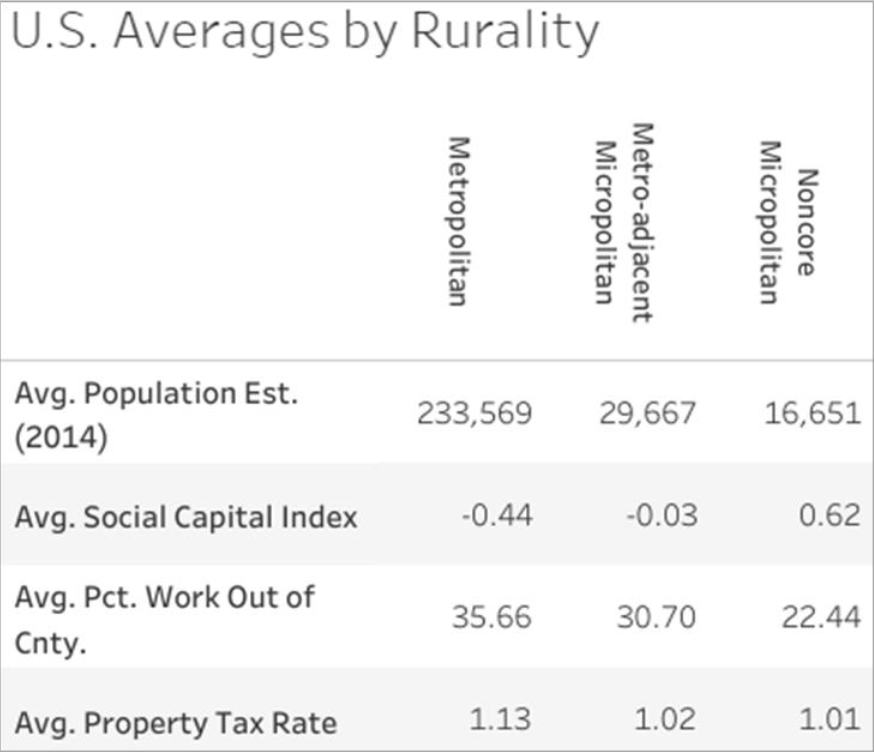
The Rurality Table is located in the bottom right corner of the Mapping Dashboard. It is important to recognize that establishment counts in rural counties and urban counties are likely very different. It is therefore not good practice for a rural county to compare themselves to an urban county, or vice versa. This table shows comparisons of the four Industry Support Measures in the County Table across the ruralities present in the counties you selected from the map or State Filter. The table will update along with your selections.
The Mapping Dashboard: 5. Downloading the Data
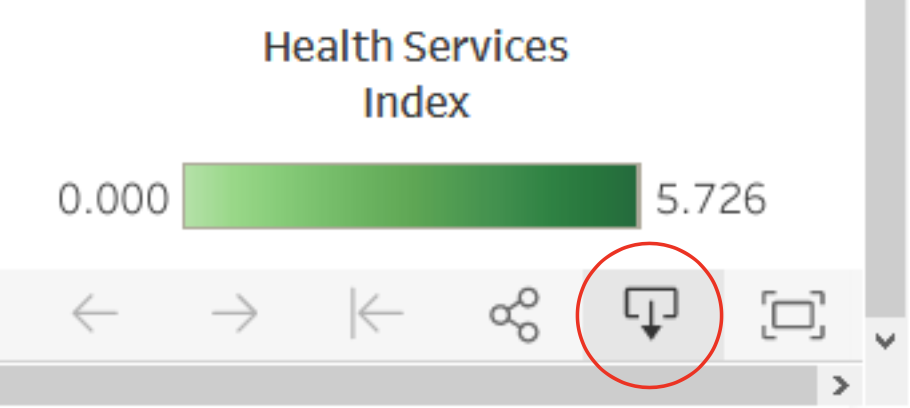 The map data are downloadable using a link on the lower-right corner of the embedded map. Data can be exported in several formats. If you select data, you can highlight and copy the data rows and paste them into Excel.
Additional Tools
At the bottom of the Mapping Dashboard you should see three blue boxes like those pictured below.
Economic Opportunity Maps Methodology Suggestions for Use
The first box, Economic Opportunity Maps, will guide you back to the home page with the introduction and list of industries organized by economic sector.
The second box, Methodology, will guide you to a webpage that explains our methods in determining which counties were “Above Predicted,” “Below Predicted,” and “Near Predicted.” This page also provides some suggestions in how to interpret each of these county types and warnings to be aware of during interpretation.
The third box, Suggestions for Use, will guide you to a webpage detailing how the EOMs may be used. The page provides suggestions for Extension professionals as well as links to publications related to topics relevant to the EOM tool.
Questions or Comments?
Craig Carpenter, Ph.D.
Assistant Professor and Extension Specialist
Texas A&M Agrilife Extension Service
Michigan State University Extension
carpe224@msu.edu
Anders Van Sandt, Ph.D.
Assistant Professor and Extension Specialist
University of Wyoming Extension
avansand@uwyo.edu
Scott Loveridge, Ph.D.
Professor and Extension Specialist
Michigan State University Extension
loverid2@msu.edu
Rebekka Dudensing, Ph.D.
Associate Professor and Extension Economist
Texas A&M Agrilife Extension Service
rmdudensing@tamu.edu
Linda Niehm, Ph.D.
Professor
Iowa State University Extension and Outreach
niehmlin@iastate.edu
This project was supported by the Agricultural and Food Research Initiative Competitive Program of the USDA National Institute of Food and Agriculture (NIFA), award number 2017- 67023-26242.
 Print
Print Email
Email