Early maturity soybean variety trial in northern Michigan in 2018
Learn about the performance of soybean varieties adapted to local conditions in northern Michigan.

Northern Michigan is a large geographic region stretching roughly from 44.5 to 47 degrees N latitude, including Michigan’s northern Lower Peninsula and Upper Peninsula. Soybean production has been common in the northern Lower Peninsula since the 1990s but is still uncommon in the Upper Peninsula. Approximately 33,000 acres of soybeans are planted across northern Michigan. Due to the generally short growing season and highly variable environmental conditions present across this large region, tailored variety recommendations are of utmost importance to soybean growers. Public variety performance information for extra-early maturity groups (RM 0.00-1.20) has previously not been available in Michigan.
In 2018, Michigan State University Extension received funding from the Michigan Soybean Promotion Committee to evaluate early maturing soybean varieties at two sites—one in northeast Michigan and one in the Upper Peninsula. Our objective was to inform farmers in northern Michigan about the performance of soybean varieties adapted to local conditions (RM 0.06-1.80). This included gathering information to identify the best-adapted range of relative maturity for each location, as well as the yield potential of individual varieties.
Forty-one soybean varieties across 13 different seed brands were planted May 22, 2018, at Escanaba, Michigan, and May 24, 2018, at Hillman, Michigan (Table 1). Plots were 4-feet wide by 16-feet long with 7-inch row spacing planted at 170,000 seeds per acre, and boarders were planted to minimize edge effect. A 3-D electrified fence, intended to deter wildlife, surrounded the trials. 0-14-42 fertilizer was applied at 200 pounds per acre at planting. Post-emergence herbicide [Raptor at 4 ounces per acre, plus 1 quart of NIS per 100 gallons water and 1 quart of Boost AD (AMS) per 100 gallons water] was applied June 21 at Hillman and June 22 at Escanaba, followed by a second application July 9 at Escanaba (Select at 16 ounces per acre, plus 1 quart of crop oil per acre).
|
Table 1. Soybean yield in the Escanaba trial by brand and relative maturity. (*Denotes varieties that yielded significantly higher than the lowest yielding variety. **Denotes the highest yielding variety.) | |||||||||
|---|---|---|---|---|---|---|---|---|---|
|
Brand |
Variety |
Maturity Group |
Yield (bu/ac) |
Sig. |
Brand |
Variety |
Maturity Group |
Yield (bu/ac) |
Sig. |
|
Asgrow |
AG08X8 |
0.8 |
59.4 |
Legacy Seeds |
LS0935N |
0.9 |
76.5 |
* |
|
|
Asgrow |
AG09X9 |
0.9 |
76.1 |
* |
Legacy Seeds |
LS1138N |
1.1 |
61.0 |
|
|
Asgrow |
AG11X8 |
1.1 |
67.3 |
Legacy Seeds |
LS1737N |
1.7 |
63.0 |
|
|
|
Asgrow |
AG14X8 |
1.4 |
77.6 |
** |
LG Seeds |
LGS0774RX |
0.7 |
73.2 |
* |
|
Dairyland |
DSR-0418 |
0.4 |
51.5 |
LG Seeds |
C0850R2 |
0.8 |
74.1 |
* |
|
|
Dairyland |
DSR-0988 |
0.9 |
72.3 |
* |
LG Seeds |
LGSO962RX |
0.9 |
69.6 |
|
|
Dairyland |
DSR-1120 |
1.2 |
74.2 |
* |
LG Seeds |
C1000RX |
1 |
64.9 |
|
|
DF Seeds |
DF 5108 N |
1 |
67.1 |
Mycogen |
5N100R2 |
1 |
75.7 |
* |
|
|
DF Seeds |
DF 158 N |
1.5 |
58.2 |
Mycogen |
5N145R2 |
1.4 |
63.0 |
|
|
|
DF Seeds |
DF 9171 N LL |
1.7 |
63.1 |
Pioneer |
P09A53X |
0.9 |
63.6 |
|
|
|
DF Seeds |
DF 187 N |
1.8 |
42.6 |
Pioneer |
P09A62X |
0.9 |
52.7 |
|
|
|
Dyna Gro |
S11XT78 |
1.1 |
66.8 |
Pioneer |
P12A59X |
1.2 |
56.4 |
|
|
|
Dyna Gro |
S14XT98 |
1.4 |
62.4 |
Sevita |
Panorama |
0.3 |
70.0 |
|
|
|
Dyna Gro |
S18XT38 |
1.8 |
46.3 |
Sevita |
Emperor |
1.0 |
60.2 |
|
|
|
Federal Hybrids |
F067N |
0.6 |
66.1 |
Sevita |
Astor |
0.2 |
55.4 |
|
|
|
Federal Hybrids |
F087N |
0.8 |
67.5 |
Wolf River Valley |
2703 RR2 |
0.3 |
55.6 |
|
|
|
Federal Hybrids |
F106N |
1 |
73.2 |
* |
Wolf River Valley |
2606 RR2 |
0.6 |
57.5 |
|
|
Golden Harvest |
GH00631X |
0.06 |
57.1 |
Wolf River Valley |
2808RR |
0.8 |
62.5 |
|
|
|
Golden Harvest |
GH0339X |
0.3 |
46.0 |
Wolf River Valley |
CV610 |
1 |
52.2 |
|
|
|
Golden Harvest |
GH1024X |
1 |
69.7 |
ZFS |
ZFS 1916 |
1.6 |
68.4 |
|
|
|
Golden Harvest |
GH1253X |
1.2 |
75.3 |
* |
ZFS |
ZFS 1716 |
1.6 |
61.5 |
|
|
Table 2. Soybean yield in the Hillman trial by brand and relative maturity. (*Denotes varieties that yielded significantly higher than the lowest yielding variety. **Denotes the highest yielding variety overall.) | |||||||||
|---|---|---|---|---|---|---|---|---|---|
|
Brand |
Variety |
Maturity Group |
Yield (bu/ac) |
Sig. |
Brand |
Variety |
Maturity Group |
Yield (bu/ac) |
Sig. |
|
Asgrow |
AG08X8 |
0.8 |
69.6 |
* |
Legacy Seeds |
LS0935N |
0.9 |
68.2 |
* |
|
Asgrow |
AG09X9 |
0.9 |
72.1 |
* |
Legacy Seeds |
LS1138N |
1.1 |
67.6 |
* |
|
Asgrow |
AG11X8 |
1.1 |
64.6 |
* |
Legacy Seeds |
LS1737N |
1.7 |
75.5 |
* |
|
Asgrow |
AG14X8 |
1.4 |
74.2 |
* |
LG Seeds |
LGS0774RX |
0.7 |
59.0 |
|
|
Dairyland |
DSR-0418 |
0.4 |
62.3 |
LG Seeds |
C0850R2 |
0.8 |
62.6 |
|
|
|
Dairyland |
DSR-0988 |
0.9 |
64.5 |
* |
LG Seeds |
LGSO962RX |
0.9 |
64.7 |
* |
|
Dairyland |
DSR-1120 |
1.2 |
68.0 |
* |
LG Seeds |
C1000RX |
1 |
71.1 |
* |
|
DF Seeds |
DF 5108 N |
1 |
71.0 |
* |
Mycogen |
5N100R2 |
1 |
70.0 |
* |
|
DF Seeds |
DF 158 N |
1.5 |
68.1 |
* |
Mycogen |
5N145R2 |
1.4 |
68.4 |
* |
|
DF Seeds |
DF 9171 N LL |
1.7 |
66.8 |
* |
Pioneer |
P09A53X |
0.9 |
68.3 |
* |
|
DF Seeds |
DF 187 N |
1.8 |
61.0 |
Pioneer |
P09A62X |
0.9 |
67.2 |
* |
|
|
Dyna Gro |
S11XT78 |
1.1 |
61.3 |
Pioneer |
P12A59X |
1.2 |
66.7 |
* |
|
|
Dyna Gro |
S14XT98 |
1.4 |
76.0 |
** |
Sevita |
Astor |
0.2 |
50.9 |
|
|
Dyna Gro |
S18XT38 |
1.8 |
72.9 |
* |
Sevita |
Panorama |
0.3 |
51.8 |
|
|
Federal Hybrids |
F067N |
0.6 |
61.1 |
Sevita |
Emperor |
1.0 |
65.8 |
* |
|
|
Federal Hybrids |
F087N |
0.8 |
64.5 |
* |
Wolf River Valley |
2703 RR2 |
0.3 |
55.0 |
|
|
Federal Hybrids |
F106N |
1 |
70.1 |
* |
Wolf River Valley |
2606 RR2 |
0.6 |
55.4 |
|
|
Golden Harvest |
GH00631X |
0.06 |
56.3 |
Wolf River Valley |
2808RR |
0.8 |
66.9 |
* |
|
|
Golden Harvest |
GH0339X |
0.3 |
49.7 |
Wolf River Valley |
CV610 |
1 |
59.4 |
|
|
|
Golden Harvest |
GH1024X |
1 |
68.8 |
* |
ZFS |
ZFS 1916 |
1.6 |
65.4 |
* |
|
Golden Harvest |
GH1253X |
1.2 |
68.8 |
* |
ZFS |
ZFS 1716 |
1.6 |
63.2 |
|
One aspect of soybean variety selection involves determining what maturity group range is appropriate for a given location. Maturity group, or relative maturity (RM), is a relative rating of the length of time between soybean emergence and physiological maturity. Soybean development is driven by the interaction of emergence date, night length and temperature. Later maturing varieties require longer night (shorter days) to initiate flowering, and are more photoperiod sensitive, than early maturing varieties. A one-unit difference in RM adds approximately 10 calendar days for a variety to reach maturity.
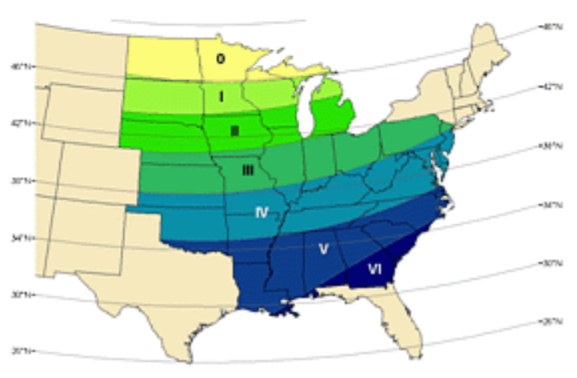
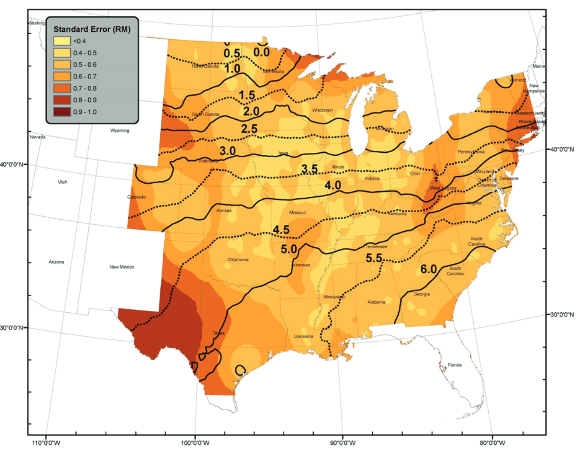
Competitive soybean yields can be achieved independent of RM when varieties are selected from within an adapted RM range of 0.5-1.0 units for a given location, according to Staton, 2017. However, RM is a rather imprecise rating that varies between seed suppliers, and there is also some disagreement about what the best adapted RM range is for northern Michigan. Zhang et al. (2007, Fig. 1) suggested growers in the northern Lower Peninsula and southern Upper Peninsula should be planting group 1.0-2.0 soybeans. This recommendation was amended somewhat by Mourtzinis and Conley (2017, Fig. 2) who found that a tighter and slightly higher range of RM 1.5-2.0 was more likely to maximize yield potential across northern Michigan.
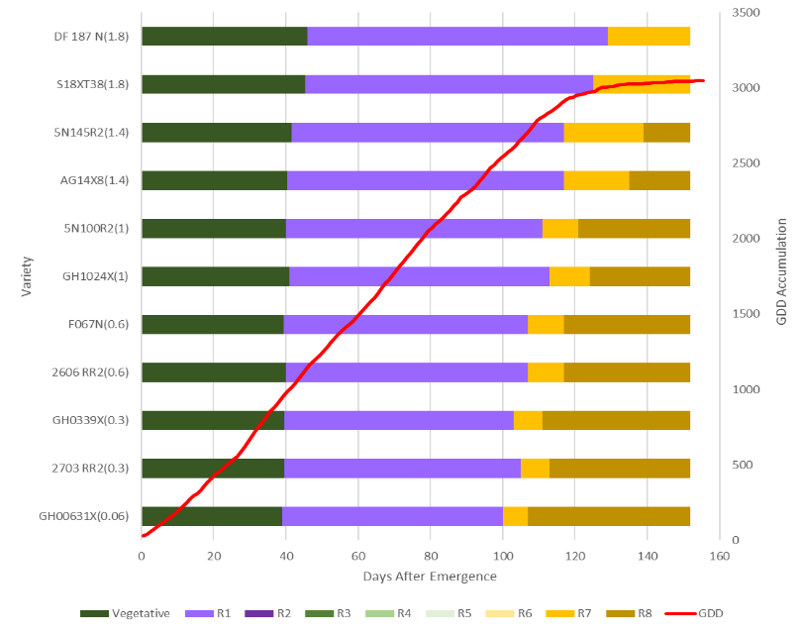
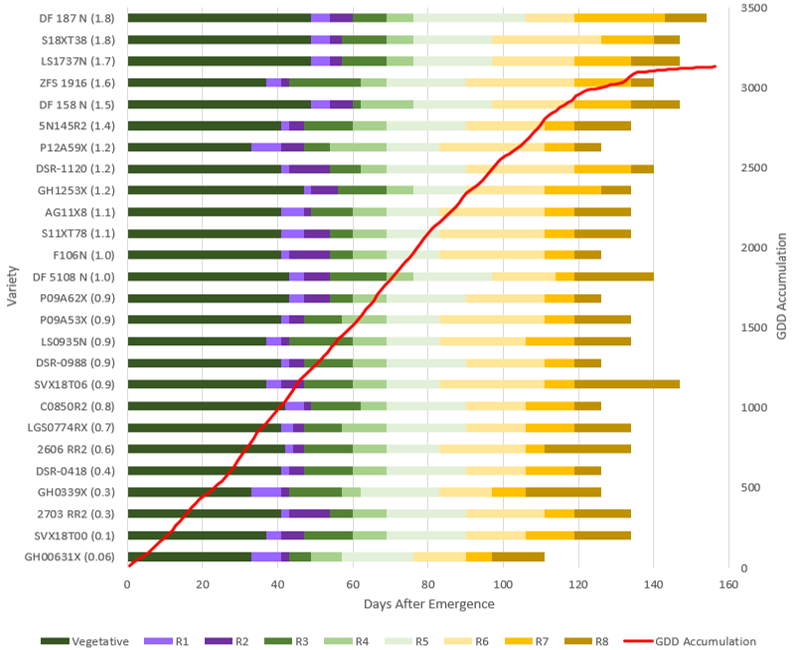
To help growers make informed decisions about RM when selecting soybean varieties, we recorded growing degree day accumulation and weekly observations of growth and development in 11 varieties at Escanaba and 26 varieties at Hillman. This provided quantitative information about differences across RM, environment, brand, etc. (Fig. 3-4). Note that growing degree day accumulation was above normal, and precipitation was below normal at both locations in 2018.
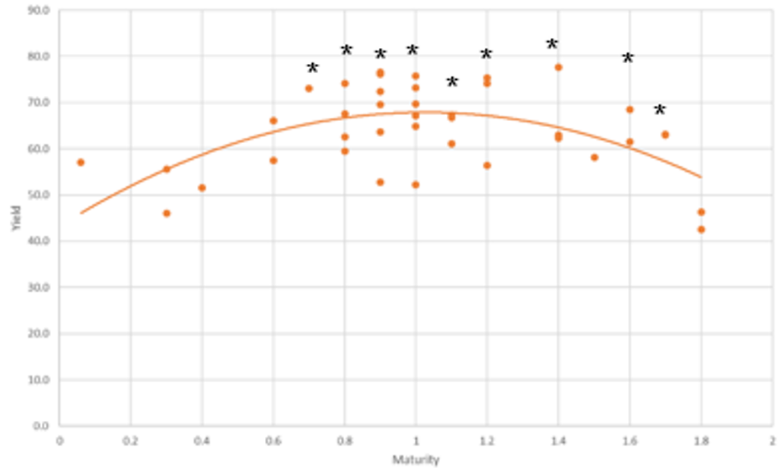
Soybeans were harvested Oct. 25 at Hillman and Oct. 31 at Escanaba using a Winterstieger plot combine. Seed was weighed and yield corrected for moisture content to a standard 13 percent. The trial at Escanaba averaged 63.70 bushels per acre, with the lowest yielding variety producing 42.60 bushels per acre and the best performing variety yielding 77.60 bushels per acre. Ten varieties yielded significantly more than the lowest yielding variety (P < 0.001). The average yield for Delta and Menominee counties is 41.0 bushels per acre, according to NASS.
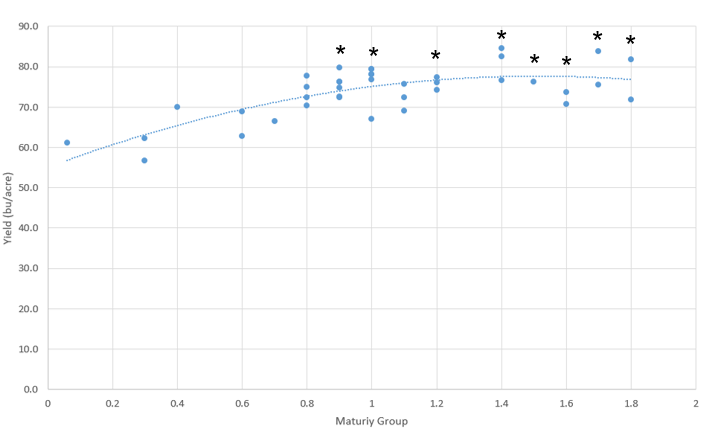
The trial at Hillman averaged 65.10 bushels per acre, with the lowest yielding variety producing 49.70 bushels per acre and the best performing variety yielding 76.00 bushels per acre. Twenty-eight varieties yielded significantly more than the lowest yielding variety (P = 0.0018). Our plot average yield was 80 percent above the 10-year Montmorency County average soybean yield (36 bushels per acre), likely because the plot was on virgin soybean ground following forage in rotation, and also fenced to exclude deer.
We also sought to better understand the interaction of relative maturity and soybean yield potential. Analyzing the data this way revealed that the range of relative maturity necessary to maximize yield in 2018 was higher than expected. At Escanaba, relative maturity groups 0.7-1.7 yielded significantly greater than earlier (RM 0.06-0.6) and later (RM 1.8) maturity groups (P=0.001) (Fig. 5). At Hillman, the earliest maturity groups (RM < 0.80) yielded significantly less than later maturity groups (P=0.002) (Fig. 6). This suggests there may be an advantage to planting later maturing soybeans in the region. However, 2018 was warmer than average, and growers may still be interested in early varieties to permit timely soybean harvest or wheat planting.
Special acknowledgement to the staff at the MSU Upper Peninsula Research and Extension Center and MSU Extension Presque Isle County for their work on this trial, including Christian Kapp, Andy Bahrman and Christian Tollini. For questions related to this research project, please contact Monica Jean, MSU Extension field crops educator, at 906-786-3032 or atkinmon@anr.msu.edu.


 Print
Print Email
Email