Lake Superior water levels nearing monthly record highs
Shoreline erosion and coastal damages likely. Water will also make its way down through the other Great Lakes, too.

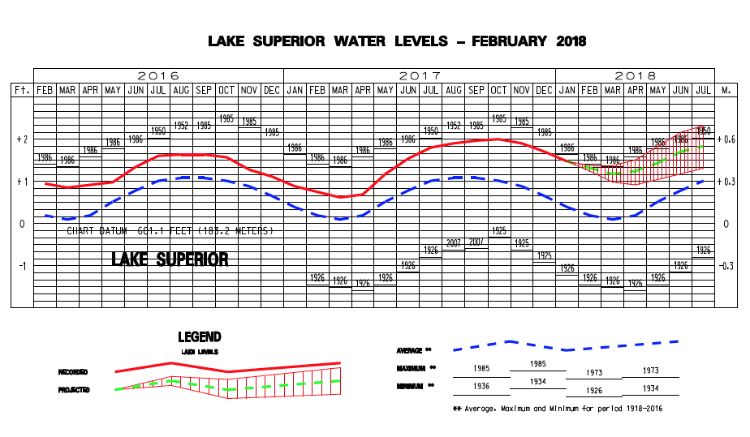
Monthly forecasts for Great Lakes levels in February 2018 have just been released by the U.S. Army Corps of Engineers. Many people are keeping a close eye on current lake levels and future predictions, particularly for Lake Superior. The preliminary data just in for January 2018, show Lake Superior just set the second highest monthly record level, a mere 2 inches below its all-time record for the monthly average January (record set in 1986). The recently released forecast also indicates a high probability Lake Superior could be within 2 inches of its all-time record high levels for every one of the next six months. Put simply, there is a lot of water in Lake Superior and all of that water will eventually make its way through the other Great Lakes.
100 years of data
Also, 2018 marks the centennial year of accurate lake level measurements from the series of binational gaging stations . The measurements for Lake Superior are taken in Duluth, Minn.; Marquette, Mich.; Pt. Iroquois, Mich.; Thunder Bay and Michipicoten, Ontario. There are now 100 years of coordinated data -- this geographically dispersed gaging network accounts for seiches and provides excellent information – and thus 100 January monthly averages.
Isn’t Lake Superior’s water level controlled?
The International Lake Superior Board of Control has a Regulation Plan 2012 and is responsible for regulating the outflow and control works in the St. Mary’s River. This Board has been in place since 1914 and has compensating works which allow for some limited variation. This plan must meet multiple objectives including hydropower; municipal and industrial water supply, navigation through the locks, and maintaining a minimum flow for protection of fish habitat in the St. Mary’s River. The January 2018 control board update states:
“In consideration of the continuing high water levels in the upper Great Lakes, the International Lake Superior Board of Control, under authority granted to it by the International Joint Commission (IJC), will continue to release outflows of up to 2,510 cubic metres per second (m3/s) through the winter months. This flow is 100 m3/s more than the normal winter maximum prescribed by Regulation Plan 2012. Actual outflows may vary depending on hydrologic and ice conditions, as well as maintenance activities at the hydropower plants on the St. Mary’s River, all of which have been directed to flow at their maximum available capacity.”
Additionally, the Board noted:
“The high levels coupled with strong winds and waves have resulted in shoreline erosion and coastal damages across the upper Great Lakes system. As lake ice begins to form this may provide a level of protection to some areas of the shoreline, but additional shoreline erosion and coastal damages may occur this winter should active weather continue.”
System snow in Lake Superior impacts the spring seasonal rise as the snow turns into liquid water. We’re still in the thick of winter so time will tell if the 2018 seasonal rises are low, average, or high. Regardless of how much changes over the next few months, notable shoreline erosion and coastal damages can be expected on Lake Superior shores. (View above image at https://www.glerl.noaa.gov/data/wlevels/lowlevels/plot/Superior.jpg.)
Tools to help visualize changes
One tool for shoreline owners and other interests is the Great Lakes Shoreview risk assessment tool (http://www.greatlakesshoreviewer.org/#/great-lakes). This tool, funded by the Michigan Department of Natural Resources Office of the Great Lakes, is a web-based mapping tool that shows photos from the Lake Superior shoreline, some nearshore LIDAR data, and some risk rankings.
One other tool to note is the NOAA Lake Levels Viewer tool. Similarly, this web-based mapping tool allows users to artificially fluctuate levels up or down and see impacts on the shore. The tool is found on NOAA’s Digital Coast website at https://coast.noaa.gov/llv/. Select the lake you are interested in, zoom to your geographic area, and use the legend bar to vary the lake levels. You will see impacts on the screen.
It has been a bit of a coastal dynamics wild ride, just 5 years ago all-time record-low lake levels were noted in some of the Great Lakes; now we’re dealing with almost all time highs. Keep your seat belts buckled! Contact Mark Breederland, Michigan State University Extension Sea Grant if you want more information on living with the ever-changing dynamic coastlines of the Great Lakes.
Michigan Sea Grant, partnered with MSU Extension, helps to foster economic growth and protect Michigan’s coastal, Great Lakes resources through education, research and outreach. A collaborative effort of the University of Michigan and Michigan State University, Michigan Sea Grant is part of the NOAA-National Sea Grant network of 33 university-based programs.


 Print
Print Email
Email


