Rise and fall: Lakes Michigan-Huron reach highest level since 1998 in June 2014
 Print
Print Email
EmailLake level fluctuations are normal during the year, and year-to-year. Just how much fluctuation can be expected this year in Lakes Michigan and Huron?
As a child growing up in southeast Michigan in the late 1960s and 1970s, our elementary school showed the fun and educational film, “The Rise and Fall of the Great Lakes” (National Film Board of Canada, 1968; http://www.youtube.com/watch?v=afs_A_Lz2w4 ). While this film deals with geography, glaciers and pollution, I note that the title is certainly fitting for observers of the lake level fluctuations of the Great Lakes, particularly along Lakes Michigan-Huron, during 2012-2014. Several people who have stopped by our Michigan State University Extension office have specifically noted their own visual observation of the rising lake levels on Lake Michigan.
The Rise:
The U.S. Army Corps of Engineers has just released the June 2014 data on official lake level measurements (daily and monthly averages are compiled across six gaging stations from the Georgian Bay of Lake Huron down to Milwaukee on Lake Michigan). The Michigan-Huron level is up four inches from the prior month of May 2014, and levels are now at a mean of 578.67 feet. If you notice you have less beach than a year ago or past years, this June average level is the highest that Michigan-Huron has had since 1998.
The Fall:
In January 2013, just 18 months ago, Lakes Michigan-Huron recorded the lowest recorded monthly level (576.02 feet) since coordinated data between the United States and Canada began back in 1918. In autumn 2012, there was an exceeding great drop of levels particularly due to high evaporation rates. This culminated in a record low average in December 2012 and the now all-time record in the subsequent month in January 2013.
The Math:
If you care to do math, this increase of 2.65 feet of water is across the combined surface area of Lakes Michigan-Huron, which covers an amazing 45,445 square miles of the globe. One inch of water across one square mile of surface area is 17,378,560 gallons, or 2,323,340 cubic feet of water, or 434,464 forty-gallon bathtubs of water. Therefore, for 45,445 square miles, you would have about 25,114,643,362,560 gallons—that is over 25 trillion gallons more in Lakes Michigan-Huron alone.
Parallels to 1964-1965-1966?
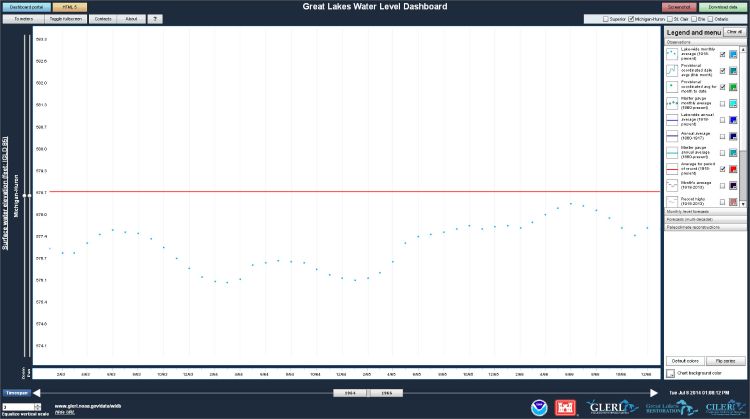
The NOAA Great Lakes Environmental Research Lab has a wonderful tool for viewing current and historical water levels, called the Great Lakes Water Level Dashboard. Prior to 2012-2013, Lake Michigan-Huron had the lowest level monthly average recorded in March 1964 at 576.05 feet. While 1964 was low in almost all months, it is notable that 1965 levels rose quickly and by June 1966 had risen to a monthly average of 578.41 feet. The system was able to rebound in 24 months back then, but we’ve had a quicker rebound in 2013/2014 (about 18 months) to current levels.
Levels for the remainder of 2014?
The Corps of Engineers’ forecast is for a peak in water levels in Lake Michigan-Huron during July 2014, perhaps one to two inches higher than the June measurements. This will be slightly below the long-term average, and still continuing a 15-consecutive-year stretch of below average levels, the longest in its period of record (since 1918).
As an educator with Michigan Sea Grant, most users of the Lake Michigan-Huron system I talk with seem to like the +/- 1 foot region close to the long-term average. This is the so-called “sweet spot” where there are no specific issues with low water levels and no impact issues for high water levels, such as occurred at the record high month of October 1986 (582.35 feet). Remember, that the lakes will continue to fluctuate due to system inputs and outputs including snowpack, precipitation, evaporation and other factors. Go out and enjoy the waters of the Great Lakes and remember the rise and fall of the Great Lakes.