


Southeast Michigan regional hop report for July 15-23, 2023
 Print
Print Email
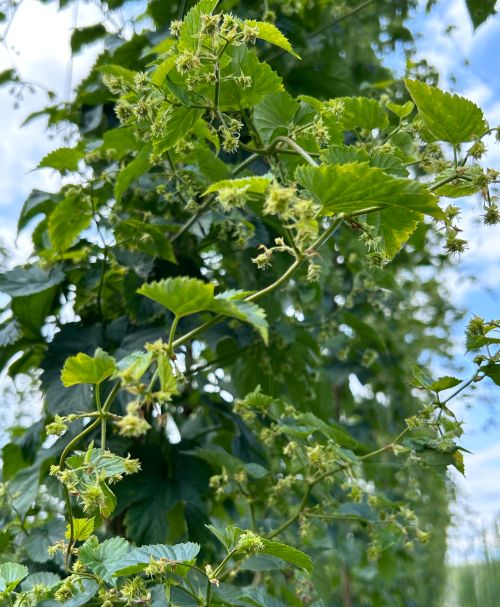
EmailHealthy crop load in southeast Michigan.
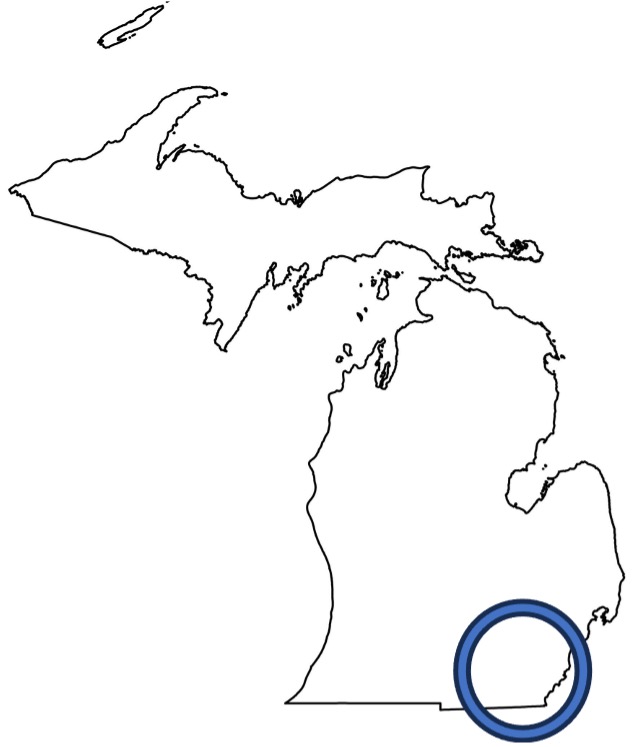
Location: Southeast Michigan
Comments
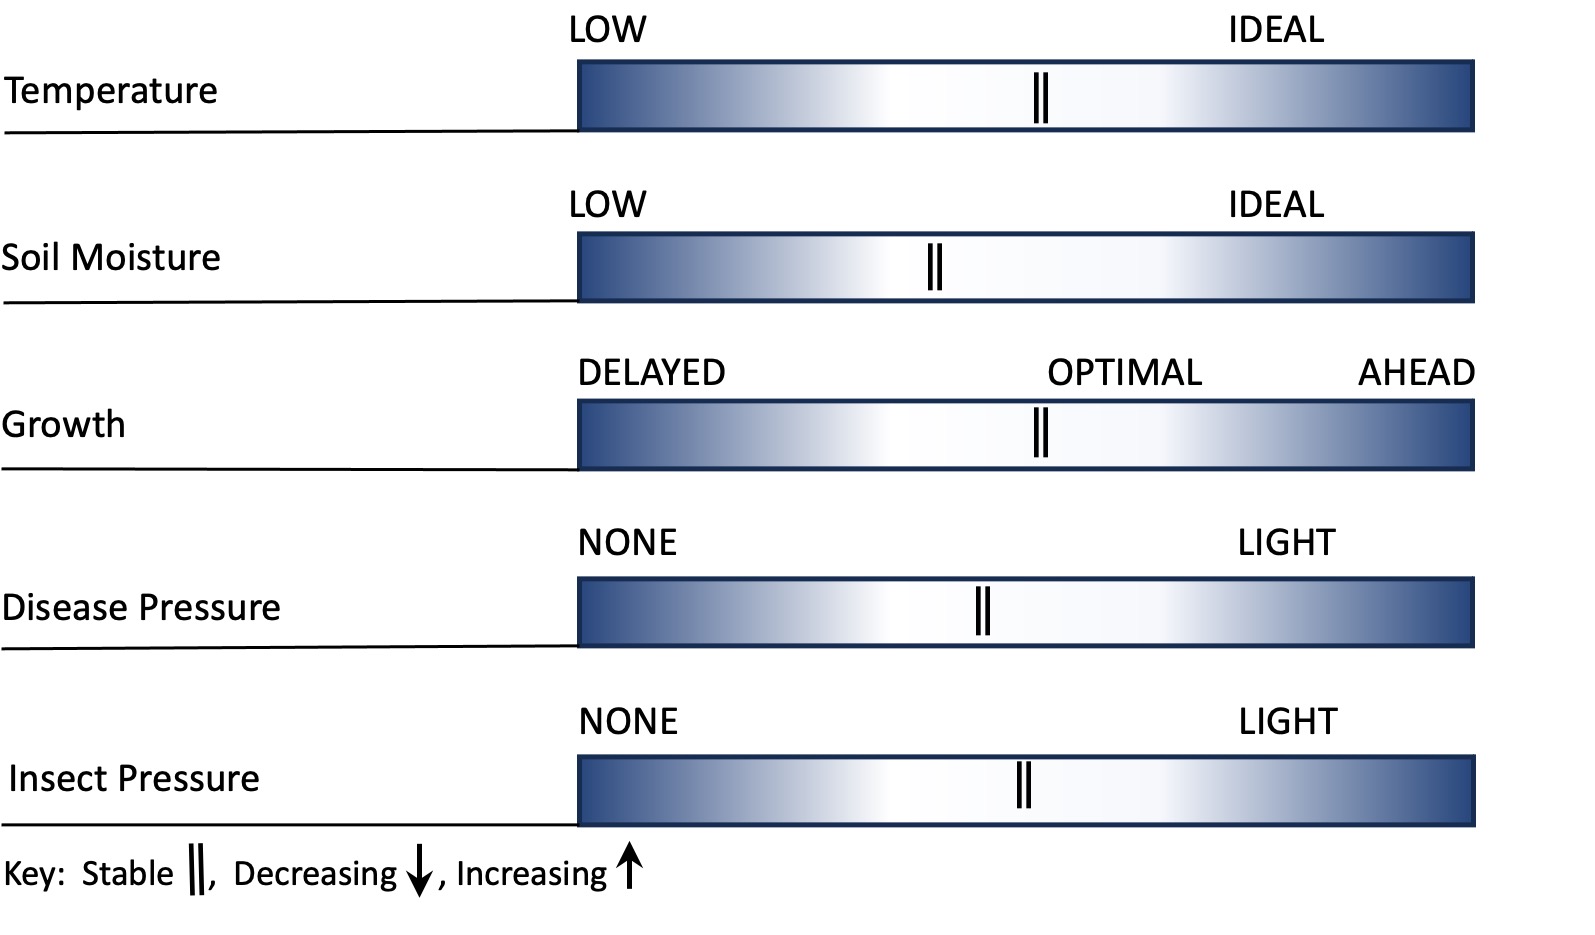
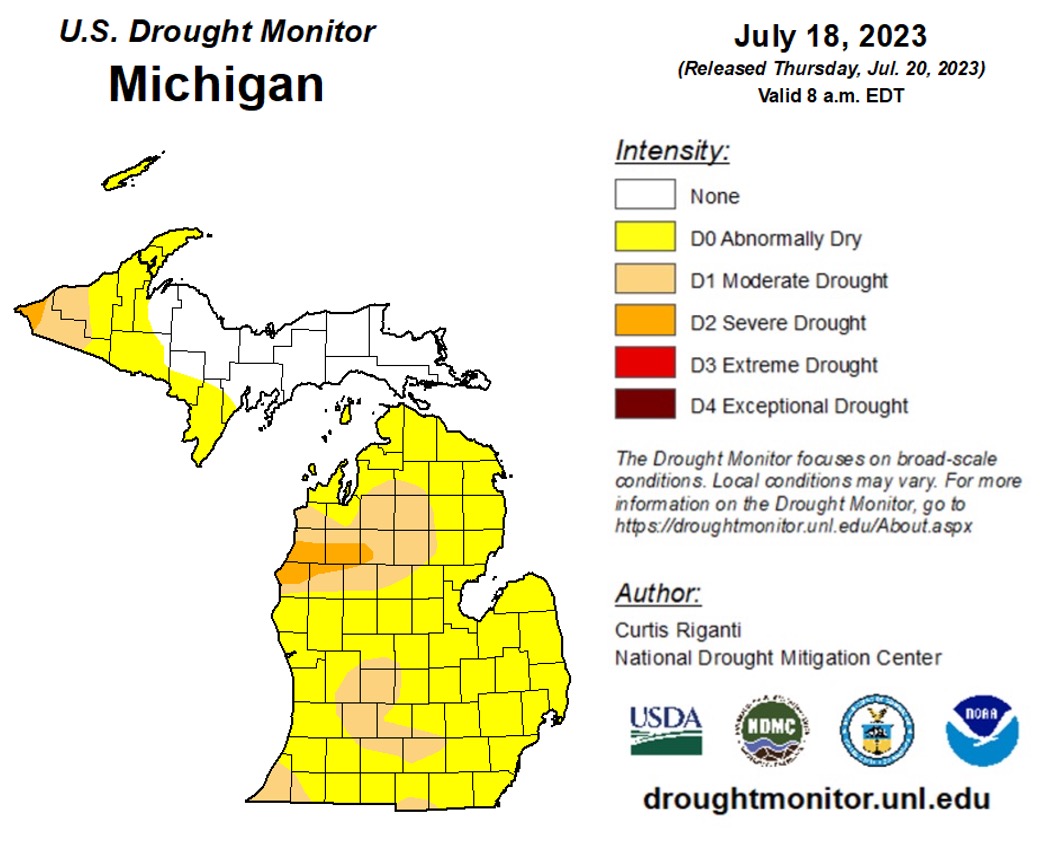
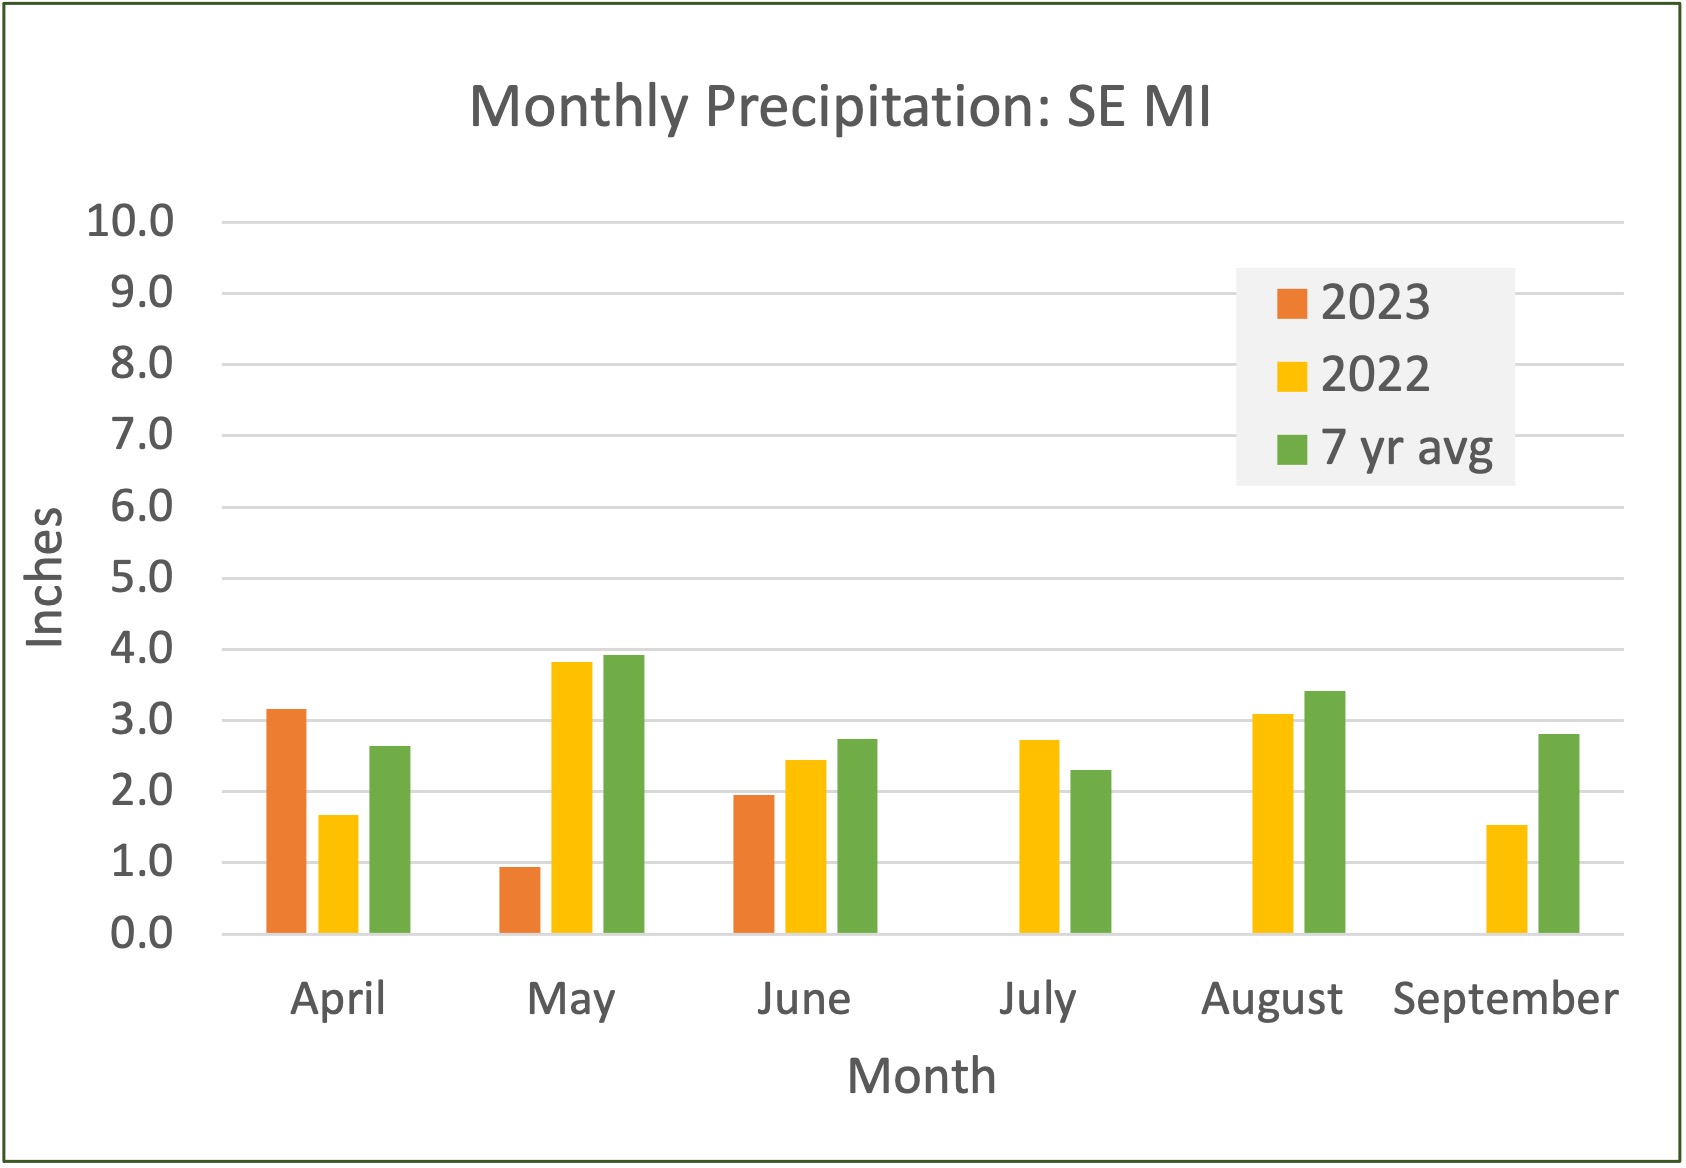
Cones, cones and more cones! Much needed rainfall has improved growing conditions. Disease and insect pressure has been light through most of the season, although mites and Japanese beetles are apparent. Crop load appears to be above average.
