


Using degree days to predict pest and crop development in blueberries
 Print
Print Email
EmailMSU’s Enviroweather system can help you predict crop and pest development.
What are growing degree days?
Growing degree days (GDD) are a useful tool for blueberry scouts, consultants and growers because they can provide early warning of key crop and pest events through the growing season. Degree days are a measure of accumulated heat, and by knowing the threshold temperature that a specific crop or insect develops at, we can calculate the amount of development (growing degree days) that will accumulate each hour or each day. A detailed explanation of degree days is available in the Michigan State University Extension article, “Understanding growing degree-days.” It is written for a different crop but the general ideas apply to blueberry bush development and insect pests, whose development is driven by temperature.
Finding local degree day values
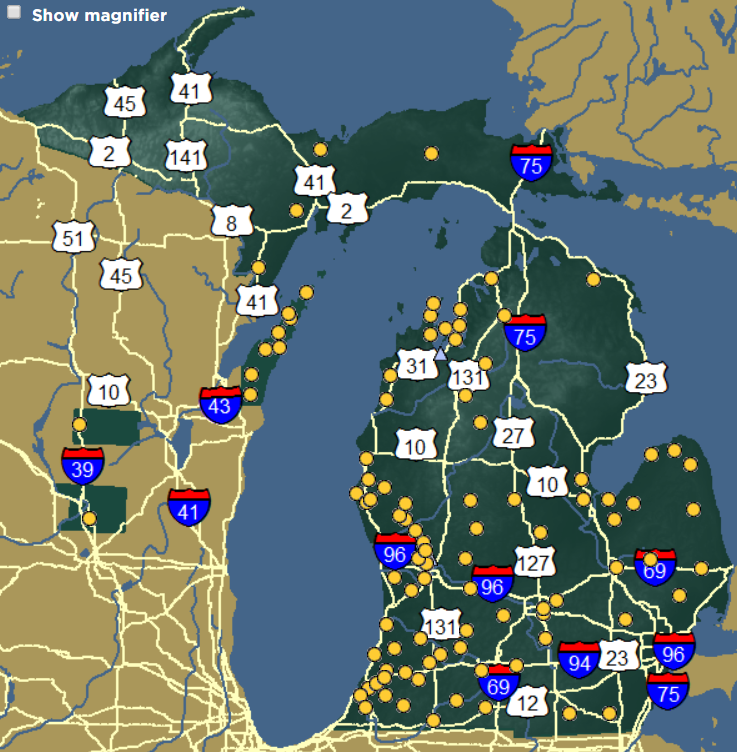
MSU maintains a network of weather monitoring stations across Michigan. These stations connect to the Enviroweather system that provides free and automatic calculation of degree days for each station. By clicking on the weather station nearest to your farm, you can scroll down to click on a line titled “Temperature, rainfall and degree-day summary”. Once the new page loads, scroll down and you will see a table that lists degree days for five different base temperatures (the lower threshold temperature for calculating degree days). This shows degree days up to today and for the week ahead. The different columns are used because different plants and insects have different temperature thresholds above which they will develop.
We have found that blueberry bushes develop above ~50 degrees Fahrenheit and most insects develop above thresholds of 42 or 50 F, so we provide target values for these two base temperatures in the table at the end of this article.
Crop phenology monitoring
We monitored pests and crop development for four years at multiple Michigan blueberry farms to develop the table below. Based on our earlier sampling, first bloom of Jersey is predicted to start at 310 GDD base 50 F. For today’s situation in Grand Junction on April 30, 2019, we are at 138 GDD with 171 GDD predicted by Monday, May 6. For earlier cultivars, these target numbers would be smaller, and bloom will be sooner. Further north or west in the state, the accumulation is slower, so we are currently at 93 GDD at the South Haven Enviroweather station and 92 GDD at the West Olive Enviroweather station.
Pest phenology monitoring
Degree days can also be used to predict pest emergence, when to put out monitoring traps and when to optimally time insecticide applications. As shown in the table below, the first cherry fruitworm moths are predicted to start their flight on average at 262 GDD base 50. This is before predicted Jersey bloom, so a good rule of thumb is to get your fruitworm pheromone traps set out in your fields in late April or early May before any of the cultivars bloom. This provides a chance to have a week or two with zero catch to be sure you detect the start of moth flight.
The table provides some GDD predictions for other key blueberry insect pests. We suggest you print this table and keep it handy during this season. With this and the Enviroweather station information, growers and consultants should be able to keep ahead of the pest development, even if it is early or late depending on the type of growing season we experience. We plan to expand the list of pests in this table based on a new project running this season and next. More blueberry pest information is available online at MSU Extension’s Blueberries website.
We stress that these are guidelines and are not validated models (which is what we are studying this season). If you are trapping for pests and also tracking GDDs in your area, your feedback on the accuracy of these values would be greatly appreciated. Please send comments to Jackie Albert at albertj@msu.edu.
Average dates and degree days of Jersey cultivar blueberry development and key insect pests. | ||||
|---|---|---|---|---|
|
Event (growth stages) |
Date first seen |
GDD 42 |
GDD 50 | |
|
Van Buren County |
Ottawa County | |||
|
Bud break |
April 17 |
April 18 |
224 |
108 |
|
Bloom |
May 14 |
May 15 |
591 |
310 |
|
Petal fall |
May 27 |
May 28 |
768 |
407 |
|
First harvest |
July 15 |
July 15 |
2,060 |
1,313 |
|
Cherry fruitworm moths | ||||
|
First |
May 10 |
May 10 |
511 |
262 |
|
Peak |
May 28 |
May 30 |
804 |
431 |
|
End |
June 12 |
June 16 |
1,180 |
683 |
|
Cherry fruitworm eggs | ||||
|
First |
June 1 |
June 2 |
872 |
472 |
|
Peak |
June 9 |
June 9 |
1,074 |
612 |
|
End |
June 21 |
June 18 |
1,337 |
797 |
|
Cranberry fruitworm moths | ||||
|
First |
May 24 |
June 1 |
758 |
412 |
|
Peak |
June 16 |
June 17 |
1,267 |
747 |
|
End |
July 17 |
July 11 |
2,018 |
1,285 |
|
Cranberry fruitworm eggs | ||||
|
First |
June 6 |
June 11 |
1,235 |
732 |
|
Peak |
June 9 |
June 13 |
1,264 |
776 |
|
End |
June 19 |
June 15 |
1,401 |
856 |
Blueberry aphids | ||||
|
First |
June 5 |
June 4 |
949 |
525 |
|
Peak |
July 4 |
July 4 |
1,715 |
1,062 |
|
End |
Aug. 8 |
Aug. 13 |
2,804 |
1,853 |
|
Parasitized aphids | ||||
|
First |
June 29 |
June 23 |
1,503 |
904 |
|
Peak |
Aug. 4 |
July 30 |
2,571 |
1,692 |
|
End |
Aug. 28 |
Aug. 13 |
3,314 |
2,246 |
|
Obliquebanded leafroller moths generation 1 | ||||
|
First |
June 15 |
June 14 |
1,208 |
695 |
|
Peak |
July 1 |
June 28 |
1,607 |
994 |
|
End |
July 29 |
July 28 |
2,434 |
1,600 |
|
Obliquebanded leafroller moths generation 2 | ||||
|
First |
Aug. 18 |
Aug. 12 |
2,968 |
1,986 |
|
Peak |
Sept. 6 |
Sept. 7 |
3,574 |
2,396 |
|
End |
Sept. 27 |
Sept. 30 |
3,980 |
2,666 |
|
Japanese beetle adults | ||||
|
First |
July 4 |
July 15 |
1,908 |
1,211 |
|
Peak |
Aug. 14 |
Aug. 11 |
2,738 |
1,832 |
|
End |
Sept. 4 |
Sept. 1 |
3,452 |
2,319 |

