USDA Farmland Cash Rental Rates
DOWNLOADAugust 22, 2025 - Jonathan LaPorte, MSU Extension
 Print
Print Email
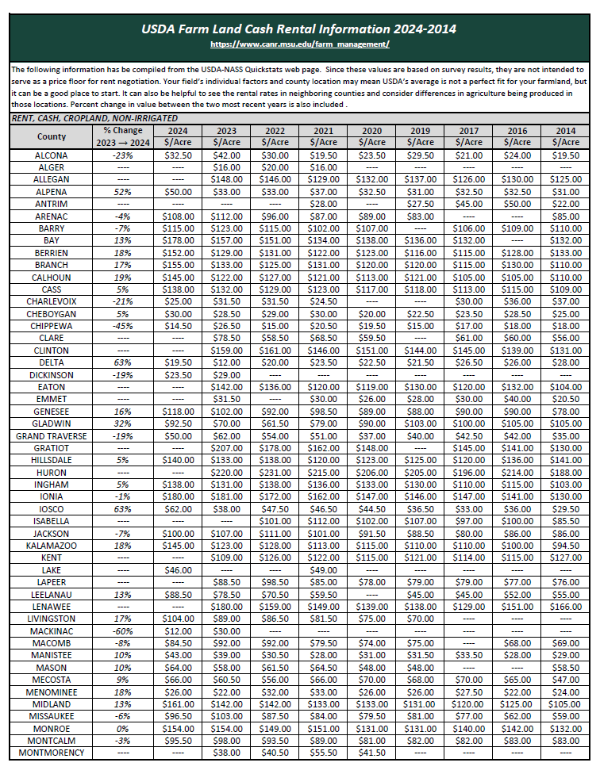
EmailThe “USDA Farmland Cash Rental Rates” document is a listing of cash rental rates by county dating from 2014 to the 2025 year. The information was obtained from the USDA's National Agricultural Statistics Service (NASS) and is based on their county-level survey results.
Results contain a mixture of annual and long-term lease agreements. Long-term lease agreements normally have fixed cash rental rates. Therefore, changes in year-to-year cash rental rates depend largely on how many new leases are included in the data. Another factor is response consistency and if all the same farms that participated last year took part in this year’s survey. The impact of these factors is essentially unknown when looking at the cash rental rates. As a result, rental rate values in this report are not intended to serve as a price floor for rent negotiation. But rather a good place to start.
It is also important to remember that land rent prices vary tremendously from county to county. In Michigan, the higher productivity soils tend to command a higher price. This includes tile drained or irrigated areas where specialty crops are grown, such as sugar beets and vegetables. Other factors can impact the price that farmers are willing and able to pay for land rent. Some of these factors can include field size, access, soil type, soil fertility, previous cropping history, and proximity to their farm operation.
Your field’s individual factors and county location may mean USDA’s average is not a perfect fit for your farmland. But it may be helpful to see rental rates for neighboring counties and consider differences in agriculture being produced in those locations.
The 2025 data indicates a mixture of changes across Michigan counties.
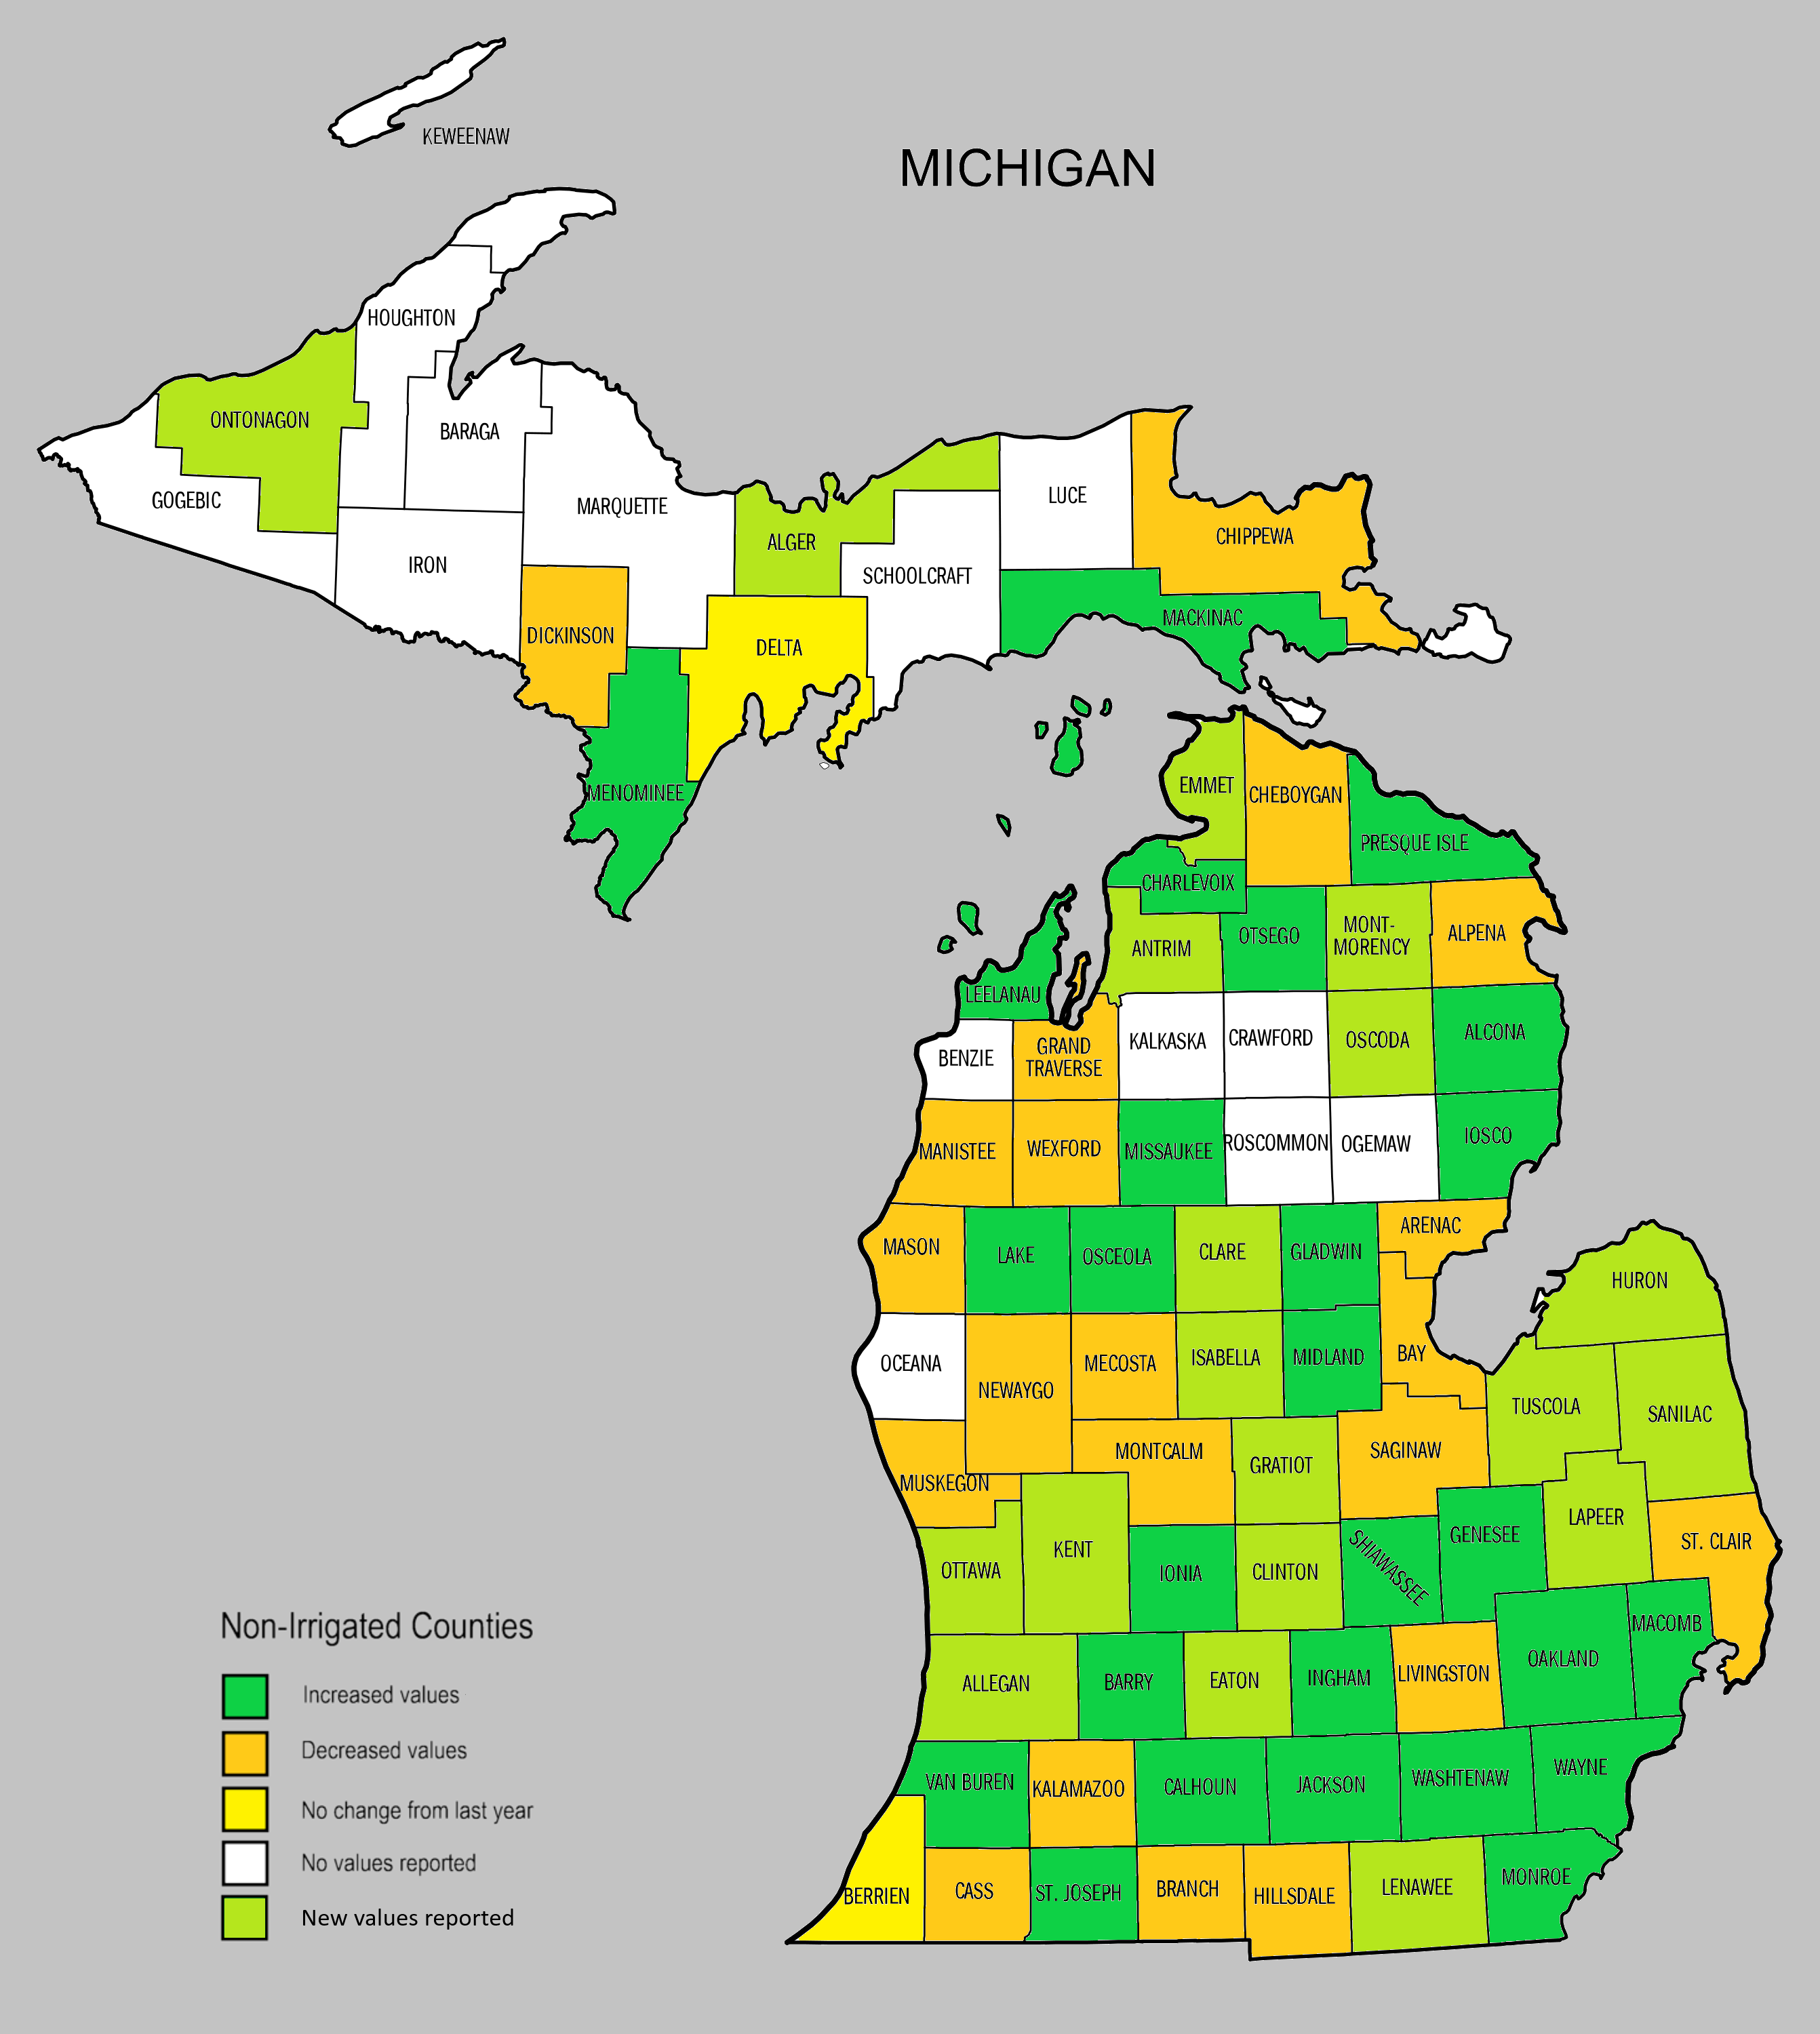
Figure 1. Non-irrigated average cash rental rate changes by county, based on 2025 USDA Quickstats survey data.
For non-irrigated counties (see Figure 1):
- 27 counties saw rental rate averages increase (down from 30 in 2024).
- 21 counties saw rental rate averages decrease (up from 17 in 2024).
- 2 counties saw no change in their average rental rate.
- 19 counties reported values for the first time since at least 2023.
- The remaining counties did not have values to report.
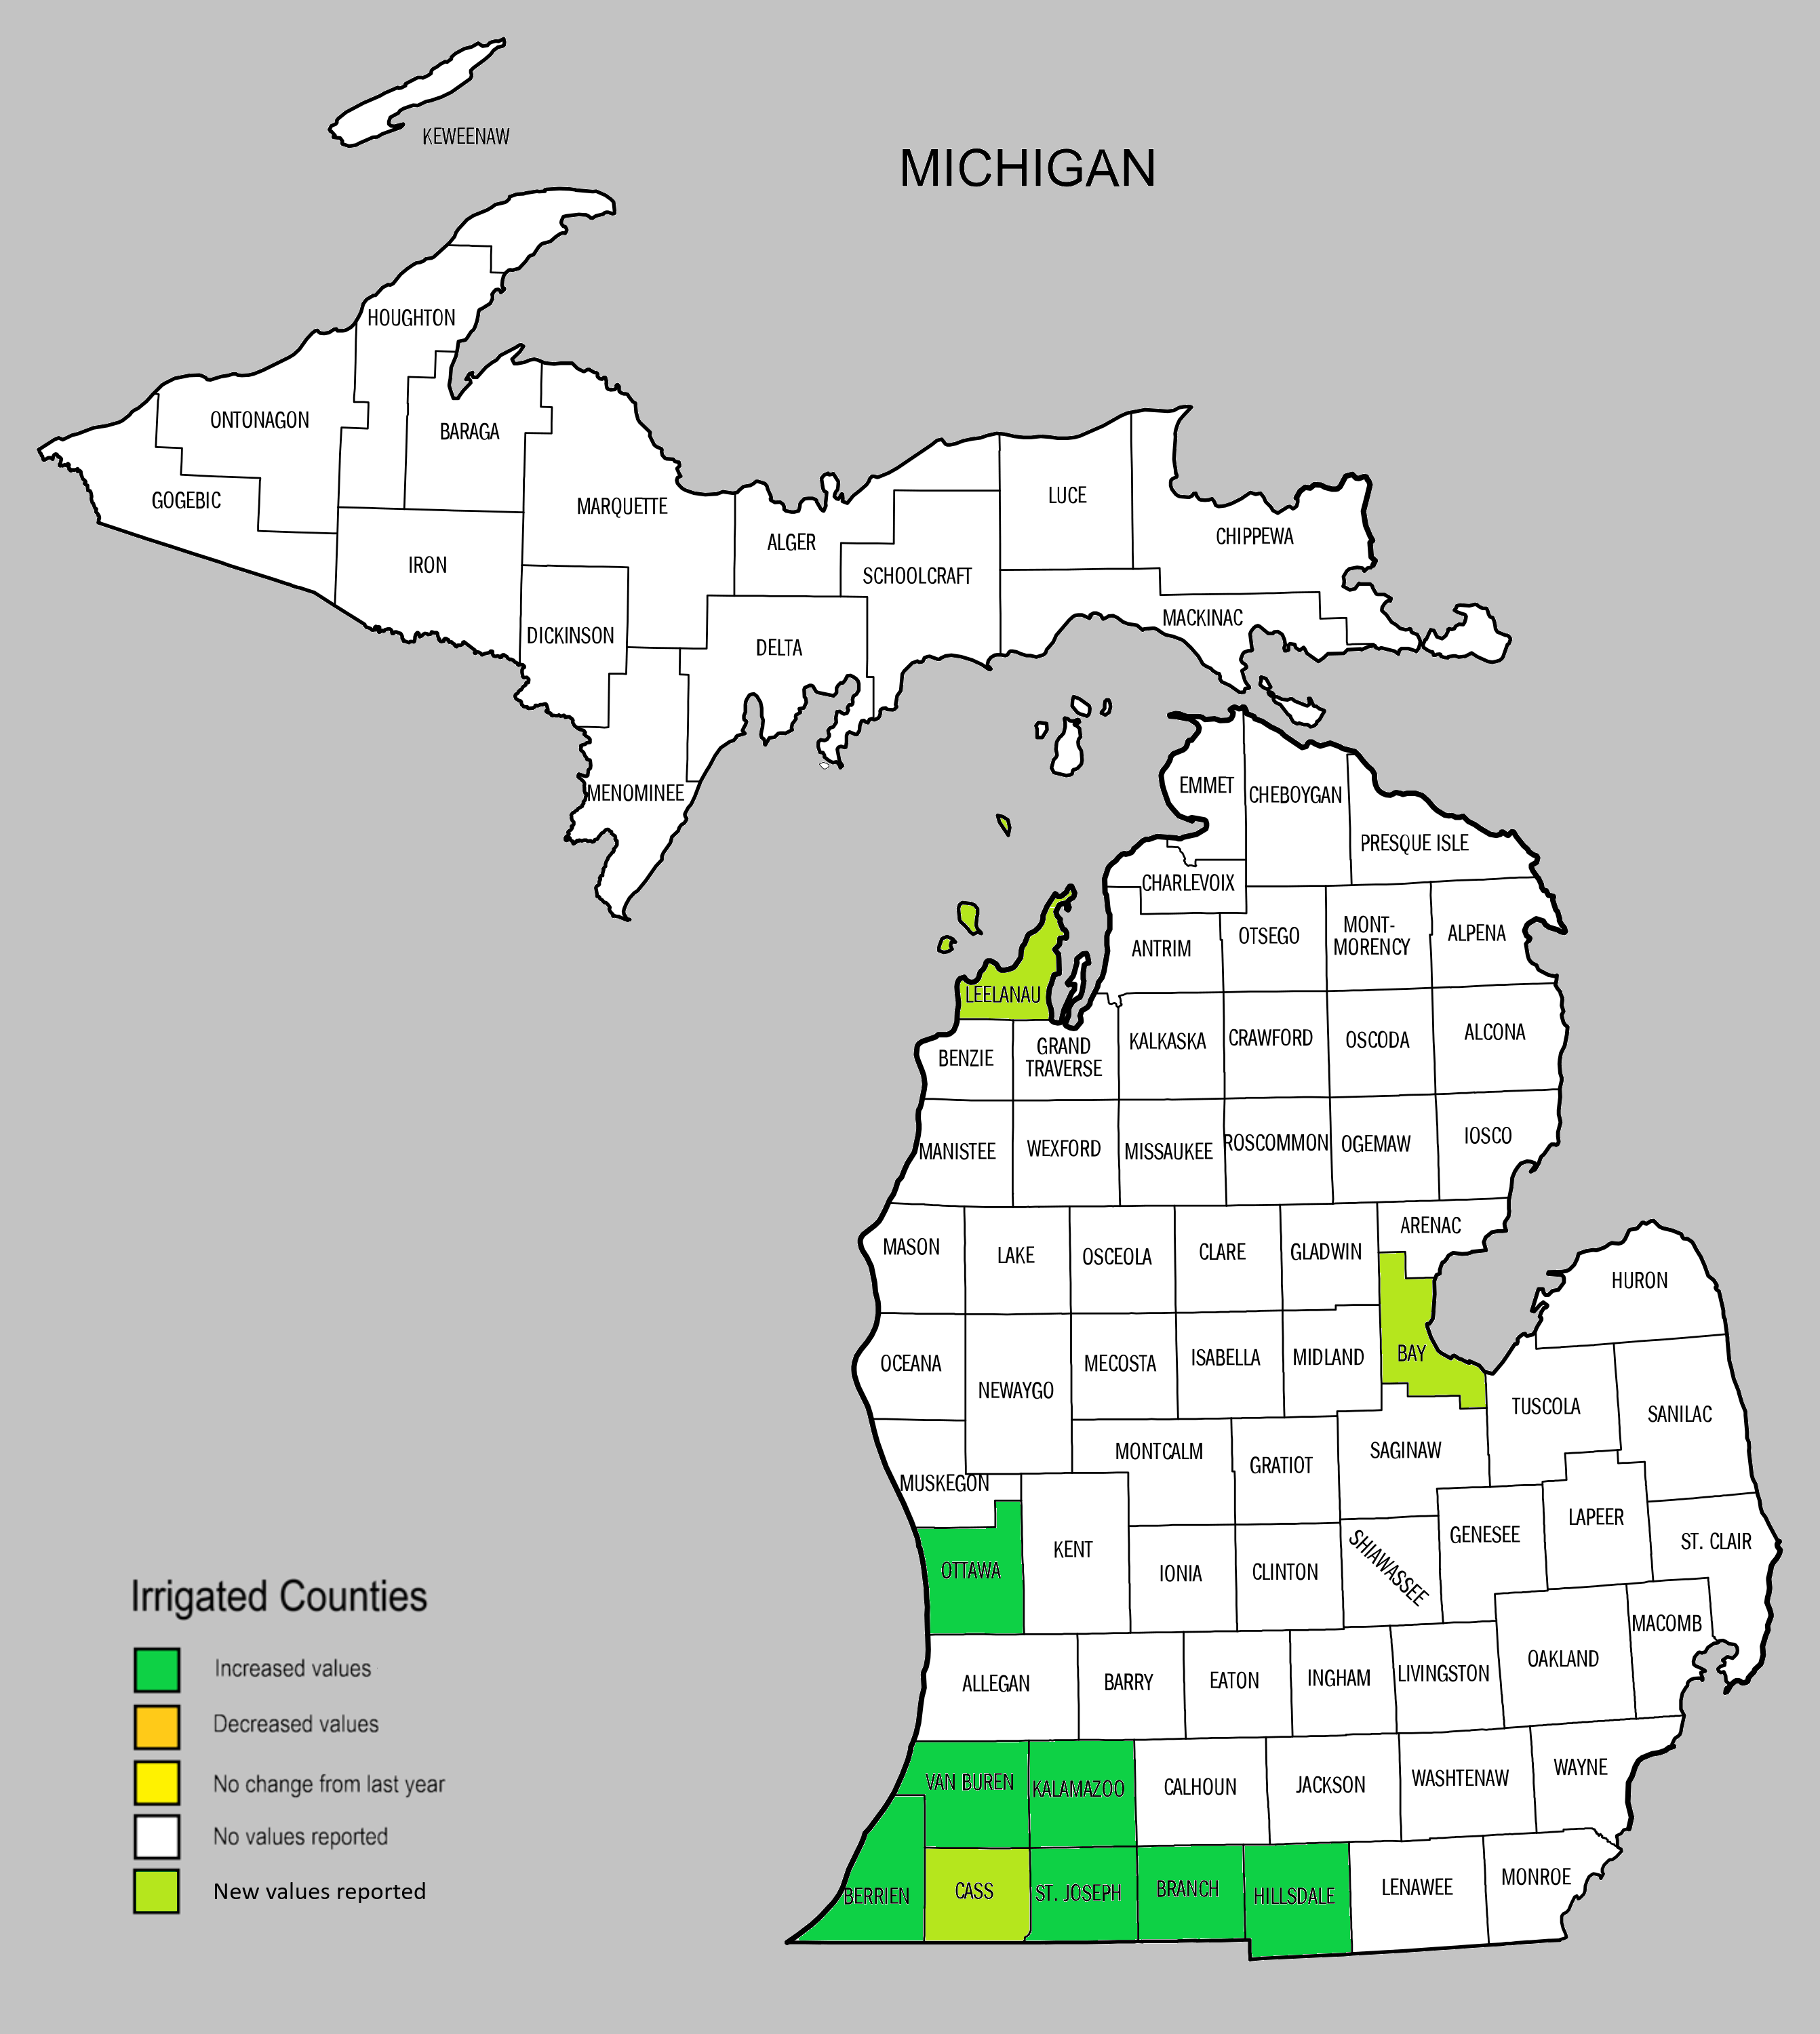
Figure 2. Irrigated average cash rental rate changes by county, based on 2025 USDA Quickstats survey data.
For irrigated counties (see Figure 2):
- 7 counties saw rental rate averages increase (same as 2024)
- 3 counties reported values for the first time since at least 2023.
- The remaining counties did not have values to report.
Pasture acres are largely absent in the 2025 report due to a lack of survey responses. Only eight counties reported values; seven of them were new since at least 2023. The lone returning county was Barry with an increase in their reported values.
The data for this report can be accessed on the USDA NASS website (www.quickstats.nass.usda.gov/).
MSU Extension has several resources to assist in determining a reasonable rental rate and help in preparing for rent negotiations. For more information, visit MSU Extension’s Farmland Leasing website: https://www.canr.msu.edu/tag/farmland-leasing.