


Travel Behaviors of Wine Tourists in Michigan’s Leelanau Peninsula
Wineries and other tourism leaders in wine regions can benefit from understanding visitor’s travel behaviors to the region.
Dan McCole, Don Holecek and Leanna Popp, Michigan State University
Editor’s note: This information was first prepared and published as part of the Northern Grapes Project.
In recent years, many rural areas have embraced wine tourism as a way of generating economic activity, and, in some cases, reviving their communities. Emerging wine areas throughout the northern United States have proven successful at attracting new tourists, and their dollars, to rural areas. Despite the positive economic activity that wine tourism brings, some community members in wine regions have concerns about the demands on existing infrastructure.
Moreover, wineries and other tourism leaders in emerging wine regions usually don’t know the full extent of their visitors’ travel patterns and might benefit from a more thorough understanding of the travel behaviors of visitors to the region. What routes are they taking to get to the wineries? How many stops do they typically make? What other attractions besides wineries are people visiting? Such information about tourists’ itineraries can help wine tourism stakeholders better understand the extent to which visitors view a region as offering an appealing menu of compatible attractions. A more thorough knowledge of tourists’ behaviors can help the tourism industry to better collaborate, craft marketing and promotional plans, and, ultimately, provide better experiences to visitors. Moreover, knowledge of how tourists move throughout a region can help tourism planners and local policymakers make informed decisions about infrastructure development.
Study Design
As part of the studies conducted to learn more about tasting room visitors, one of the objectives of the Northern Grapes Project, researchers at Michigan State University intercepted tasting room visitors in Michigan’s Leelanau Peninsula and provided them with a map of the region on which they were asked to indicate their routes taken and stops made, a survey and a return envelope. In addition to demographic questions, the survey complemented the data from the maps by asking questions about topics such as trip planning resources, planned and unplanned stops, reasons for travel and group composition.
Although the Leelanau Peninsula has long produced wines, the past decade has brought tremendous change to the region, which went from just a handful of wineries in 2000 to over 25 today (with more expected in the coming years).
The increase in the number of wineries has resulted in a growing number of wine tourists traveling through the area and has seen an increase in the impact of these tourists on its infrastructure.
A total of 227 participants were intercepted and 218 of those agreed to participate. Completed questionnaires were received from 110 participants – a response rate of 50.5 percent. The itineraries from each map were aggregated using GIS to create itinerary maps that reflect a variety of variables, including travel routes, total number of stops, visits to wineries, visits to towns and visits to other attractions.
Results
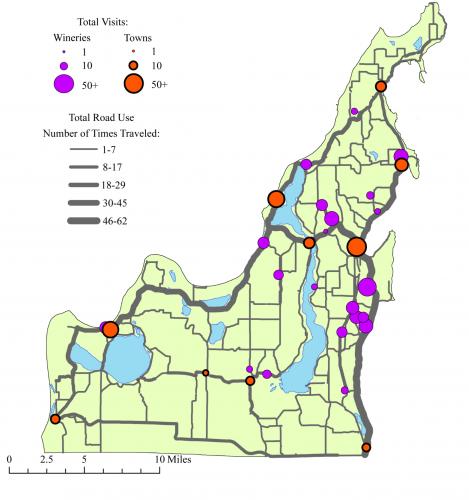
These results will act as a baseline for any future studies in this region and as a comparison point for other regions. The average number of total stops for the participants was 6.68 (Table 1). Winery visits accounted for 3.91 of these, towns accounted for 2.09 visits and other attractions accounted for less than one per each trip (0.58). This data confirms visitors go to the Leelanau Peninsula for multi-destination travel rather than just stopping at one winery and leaving the area. It also shows that although attracted by the wineries, most visitors stop at other places besides wineries, generating economic activity to other businesses in the area. Tourist itinerary routes were compiled from the map-diaries. Frequency of road travel and stops were tabulated in order to produce a graduated symbols road map of the county. The roads travelled on by participants are illustrated in Figure 1 where the thickness of the line increases with number of uses. This map also shows the proportional symbols of stops at wineries, towns and other attractions.
Table 1. Average number of stops in itineraries. | |||
|---|---|---|---|
|
Location |
Minimum |
Maximum |
Mean |
|
Wineries |
1 |
15 |
3.91 |
|
Towns |
0 |
10 |
2.09 |
|
Other attractions |
0 |
4 |
0.58 |
|
Total stops |
1 |
17 |
6.68 |
The data indicated 78 percent of visitors spent at least some time researching their destination prior to traveling and 45 percent reported spending “a lot” of time planning their trip.
Figure 1. Wine Tourism in Leelanau Peninsula.
Despite this high level of pre-trip planning, 61 percent of respondents visited wineries they had not planned to visit before traveling for the day. These unplanned stops at wineries were primarily triggered by being in close proximity to another stop on the trip, seeing a sign or passing the winery during travel (Table 2).
Table 2. Reasons for unplanned stops at wineries. | |
|---|---|
|
Item |
Mean* |
|
Close proximity to another stop |
4.07 |
|
Signs (road, other) |
3.56 |
|
Passed during travel |
3.47 |
|
Read about it |
2.50 |
|
Recognized the name |
2.43 |
|
Recommendation from someone else |
2.04 |
|
Recommendation from another winery |
1.42 |
*Means are based on a 5-point Likert Scale. 1-No impact, 5-A great deal of impact
Another interesting result from the survey involves how tourists find information about wineries while traveling. Tourism brochures (56.4 percent), wine trail information (45.5 percent), and roadside signage (44.5 percent) were the information sources used most often by wine tourists to plan their trips during their travels (Table 3). Results showed wine trail information was the primary information source for those who made the highest average number of winery visits, suggesting wine trail guides can help increase the number of stops wine tourists make when touring a region.
Table 3. Information sources used during the trip and the number of wineries visited. | ||
|---|---|---|
|
Information source |
Percent* |
Mean winery visits |
|
Brochures/ Maps |
56.4% |
4.3 |
|
Wine trail information |
45.5% |
5.2 |
|
Roadside signage |
44.5% |
4.4 |
|
GPS |
26.4% |
3.9 |
|
Mobile application/ Smart phone |
14.5% |
4.1 |
|
Recommendation from others |
13.6% |
3.7 |
|
Internet |
11.8% |
3.8 |
|
Guidebook |
9.1% |
4.3 |
|
None |
7.3% |
2.3 |
|
Other |
4.5% |
4.2 |
*Percentages totale more than 100% because respondents were able to select "all that apply."
The data suggests the majority of participants (52 percent) indicated they spent only one day visiting wineries, while another 43a percent visited wineries on two or three separate days during their trip to the area. The remaining 5a percent visited wineries on more than three days. When not at wineries, participants indicated they participated in activities including sightseeing (80 percent), visiting the beach (56 percent), fine dining (52 percent), retail shopping (66 percent) or visiting a national/state/local park or lakeshore (55 percent). Less than half of the respondents reported visiting friends/relatives (35 percent), visiting a gallery/art studio (30 percent), hiking (26 percent), visiting a site of historical or cultural significance (28 percent), visiting specialty food shops (41 percent) or going to a casino (9 percent).
Conclusions
For decades, tourism researchers have referred to the “gravity effect” in tourism, in which a large attraction draws more people than a small attraction in the same way a large planet has a stronger gravitational pull than a smaller planet. However, there is growing evidence regions that offer a number of smaller attractions can be just as appealing to tourists as ones with few large attractions, in the same way a group of stars can have greater gravitational pull than a single large star.
Multi-destination trips are becoming more popular, and wine tourism is well suited to take advantage of this trend. Tourists typically seek to satisfy a number of desires, and multi-destination travel is able to satisfy many of them, especially when the travel involves groups of people with varying interests. To the traveller, a multi-destination trip reduces the risk of disappointment by offering choices. Additionally, tourists have an economic incentive to choose multi-destination trips as they can save time and money compared to making several different trips. Wine tourism is a particularly appealing form of multi-destination travel as it tends to offer both similar attractions (a number of different wineries) and complementary attractions (fine dining, cheese shops, shopping, art galleries, etc.). This research shows people indeed tend to make multiple stops when traveling in a wine region. Moreover, the findings indicate that although most people spend time planning their trips in advance, unplanned stops are common and can be influenced by promotional materials and signage.
Finally, when we presented the results of this study to the area wineries, many were surprised to learn visitors tended to take different and less direct routes than local residents. This was a reminder that people traveling for leisure are often more interested in sightseeing and exploration than taking the quickest route. This finding has important implications for decisions about signage and can serve as a useful reminder to winery employees given directions and recommendations. Previous research (see previous issues of Northern Grapes News) has shown that leisure reasons (e.g., spending time with friends and family or doing something unique) are greater motivators for visiting wineries than wine reasons (e.g., learning more about wine or purchasing wine). Moreover, other research has shown that a person’s environment and mood can impact their enjoyment of wine. For these reasons, it is in the best interest of leaders in wine tourism regions to use the findings from this study to improve the overall trip experience for visitors
Photo credit: Joy Landis, MSU
 Print
Print Email
Email