


Irrigation trends in Michigan
 Print
Print Email
EmailA look at trends in the number of irrigated acres and overall irrigation water use.
In many regions, irrigation is a crucial tool for agricultural producers. Irrigation can raise yields in dry years and enable the cultivation of water-intensive, high-value crops. However, increases in irrigation infrastructure can also lead to increased competition for limited water resources. This article aims to provide a brief summary of the irrigation trends in Michigan over the past 25 years.
Overall irrigation trends
We examine irrigation trends using two distinct measures of irrigation: (1) irrigated area, defined as agricultural land with access to irrigation, and (2) the volume of irrigation water used. For irrigated area, we use two data sources: (1) satellite-based data from the Landsat-based Irrigation Dataset (LANID) compiled by researchers at the University of Wisconsin, and (2) United States Department of Agriculture (USDA) Census data. The LANID dataset offers field-level information on irrigation with a resolution of 30m-by-30m over the period from 1997 to 2017. The USDA Census is conducted every five years and provides county-level information on irrigated acres. These two datasets do not provide crop-specific irrigation information.
For the amount of water used for irrigation, we rely on data made available in a recent paper in the journal Water Resources Research. This dataset offers county-level information on irrigated water use from 2008 to 2020. This data is unique in that it provides information on irrigated water use by different crops as well as sources of used water, such as surface water and groundwater.
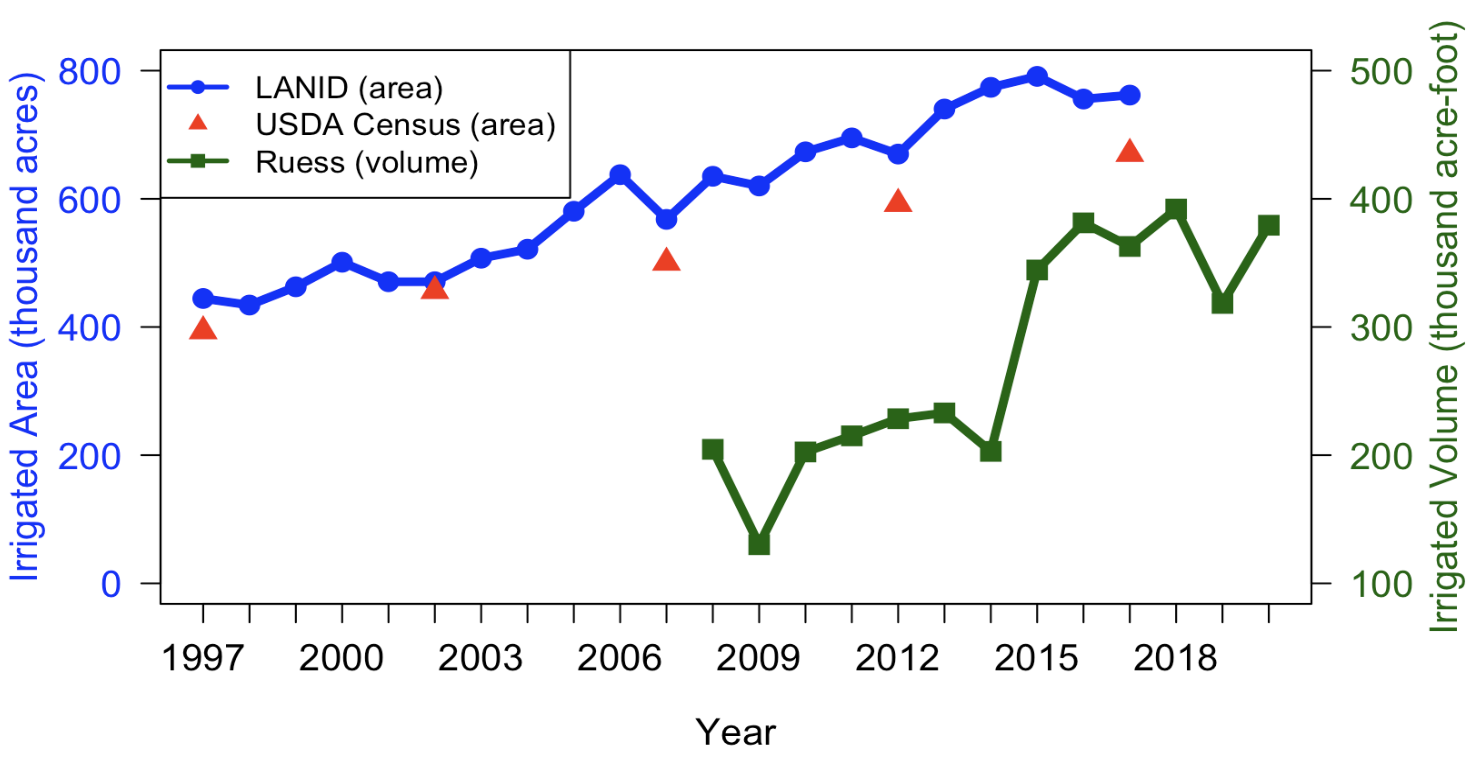
Figure 1 shows the trends of overall irrigated area and the volume of irrigation water used in Michigan. The left-hand side y-axis (in blue) represents the area and the right-hand side y-axis (in green) represents water use. Overall, irrigated area and irrigation water use have increased considerably over time. The LANID data shows that the irrigation in Michigan increased about 71% from 1997 to 2017. The USDA Census data also suggests a similar increase of 70% in irrigated areas from 1997 to 2017 in Michigan. Irrigated area in Michigan has grown much faster than in the overall U.S., where irrigated area only increased around 5% during the same period. Irrigated water use increased approximately 77% from 2008 to 2017.
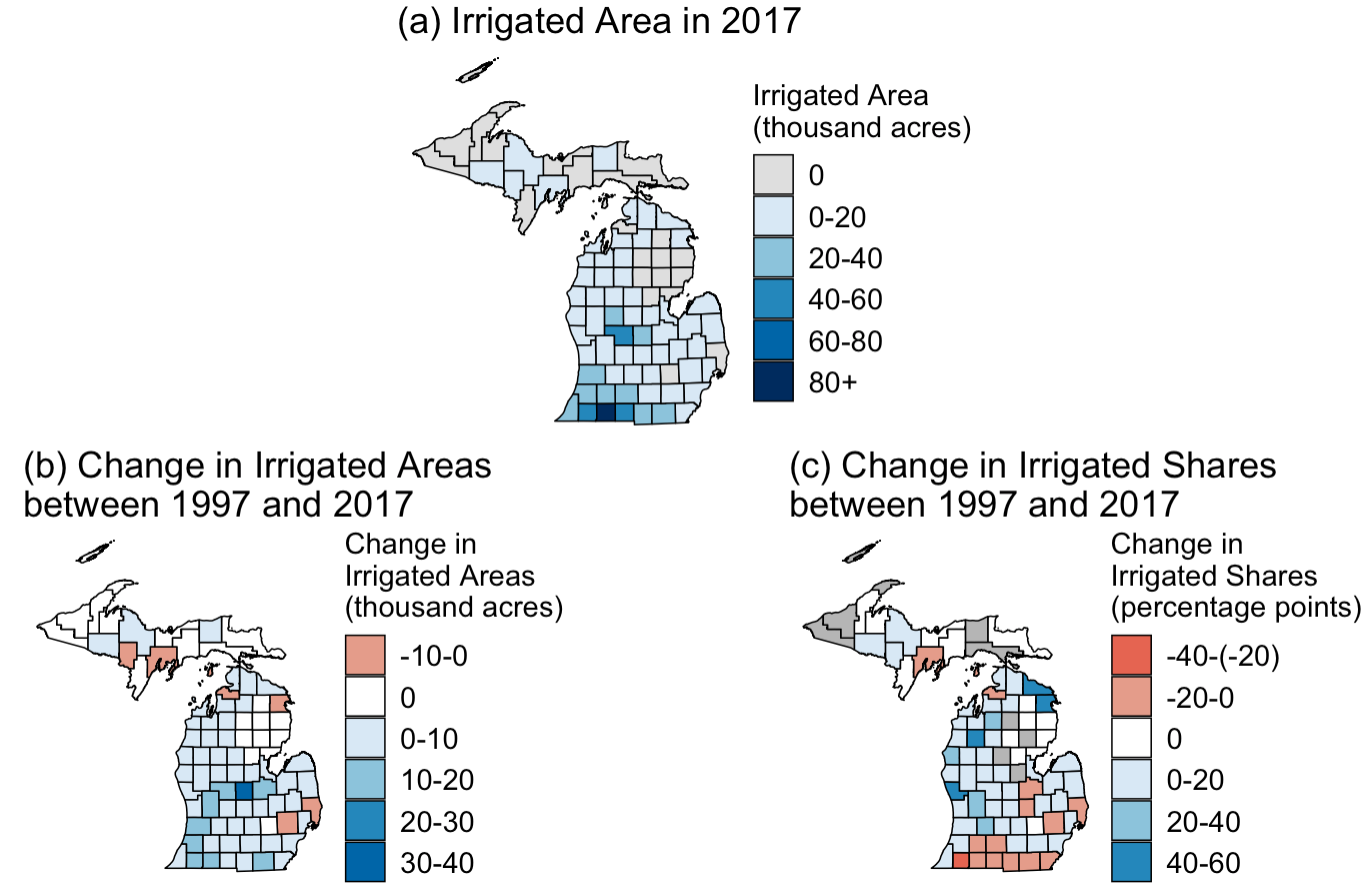
To assess the spatial differences in irrigation across Michigan, we map county-level irrigated areas in 2017, as shown in Figure 2(a). The intensity of color on the map represents the extent of irrigated areas, with darker shades indicating larger areas. We see that irrigation is primarily concentrated in the southern and central parts of the state. St. Joseph, Montcalm, Branch and Cass counties contain the most irrigated acres.
Figures 2(b) and 2(c) show the changes in irrigation by counties in Michigan between 1997 and 2017. In Figure 2(b), we look at the changes in irrigated areas measured in thousands of acres. In general, we see increases in irrigated areas in most counties, with the largest increases in the central part of the state.
Figure 2(c) shows changes in the share of cropland that is irrigated, which is measured in percentage points. Note that the pattern in Figure 2(c) is different from the pattern observed in Figure 2(b). This difference arises from changes in the total agricultural land areas. For instance, if the irrigated area increases in a county but the total cropland area experiences a more rapid expansion, the share of irrigated area would decline. For example, the amount of agricultural land in Cass County increased by 175% between 1997 and 2017, leading to a decline in the share of irrigated area, despite a 53% increase in irrigated acres.
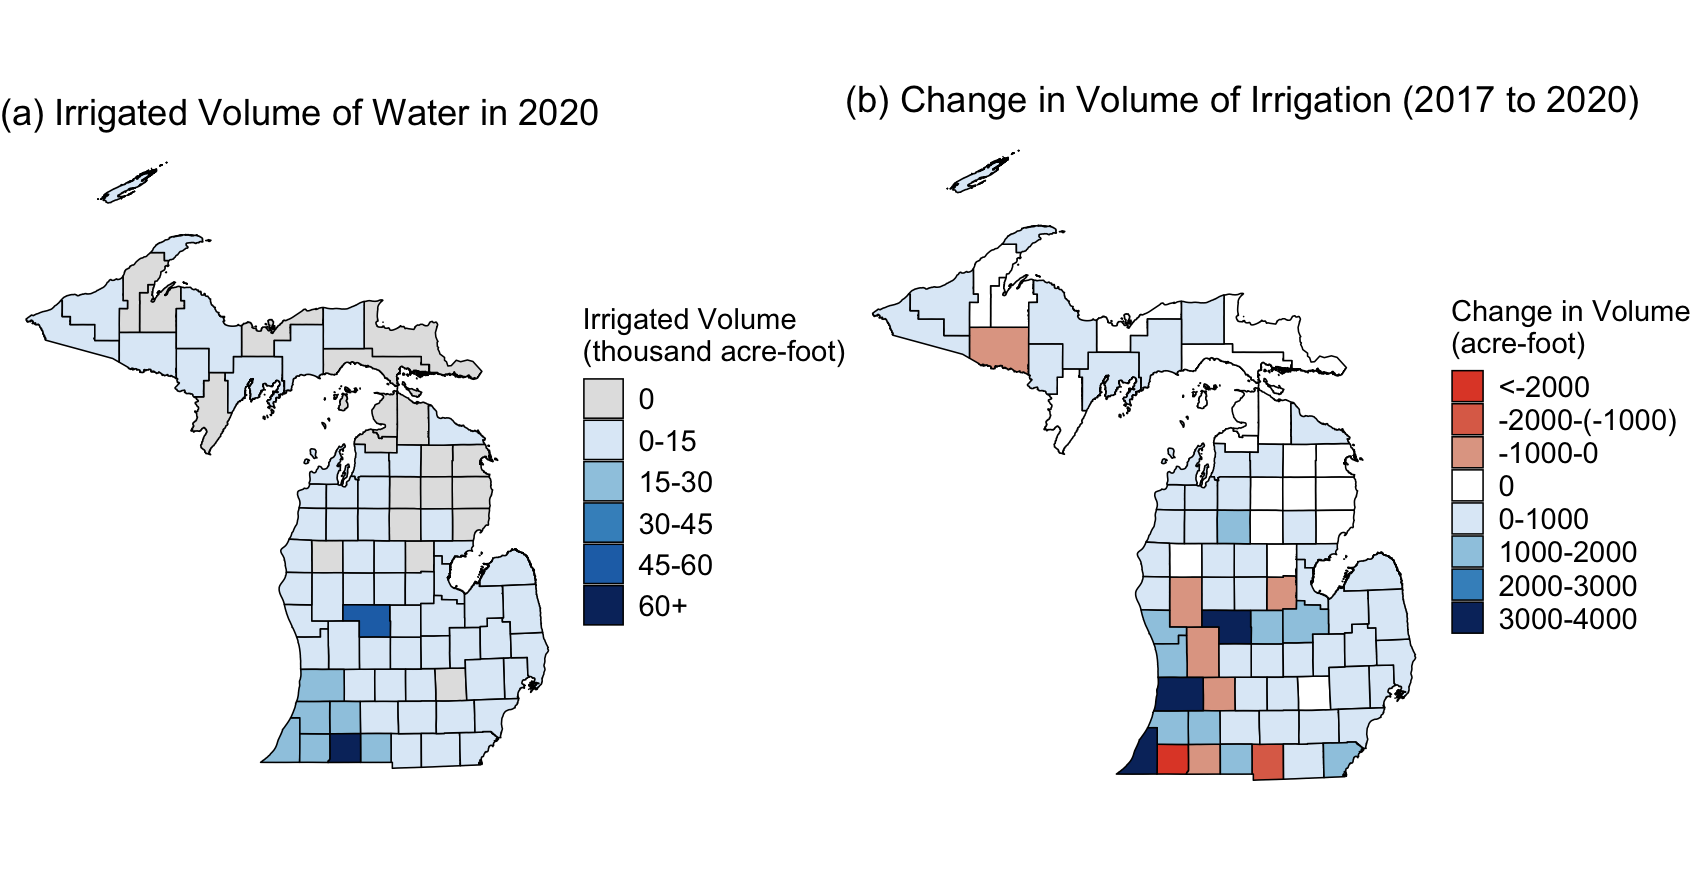
In Figure 3, we present a more recent overview of irrigation in Michigan using the data on irrigation water use. Figure 3(a) shows that irrigation water use is most common in the southern and central parts of the state, resembling the distribution observed in Figure 2(a). The changes in irrigated volume between 2017 and 2020, presented in Figure 3(b) do not present a clear pattern, with some counties seeing an increase in irrigation water use and others seeing a decrease. Overall, the state saw a modest 5% increase in irrigation water use between 2017 and 2020.
Crop-specific irrigation trends
Although the LANID data does not provide information on crop-specific irrigation, we can use its field-level information to determine the crops cultivated in each field by incorporating an additional data source called the Cropland Data Layer (CDL). The USDA releases the CDL annually. The CDL provides information on which crop was produced in a 30m-by-30m resolution in the contiguous U.S. Figure 3 shows a sample plot of the data for 2015 Michigan. Using the data from 2008 to 2017, we overlap this CDL data with the LANID data and examine the extent and changes in the number of acres under irrigation for corn and soy production.
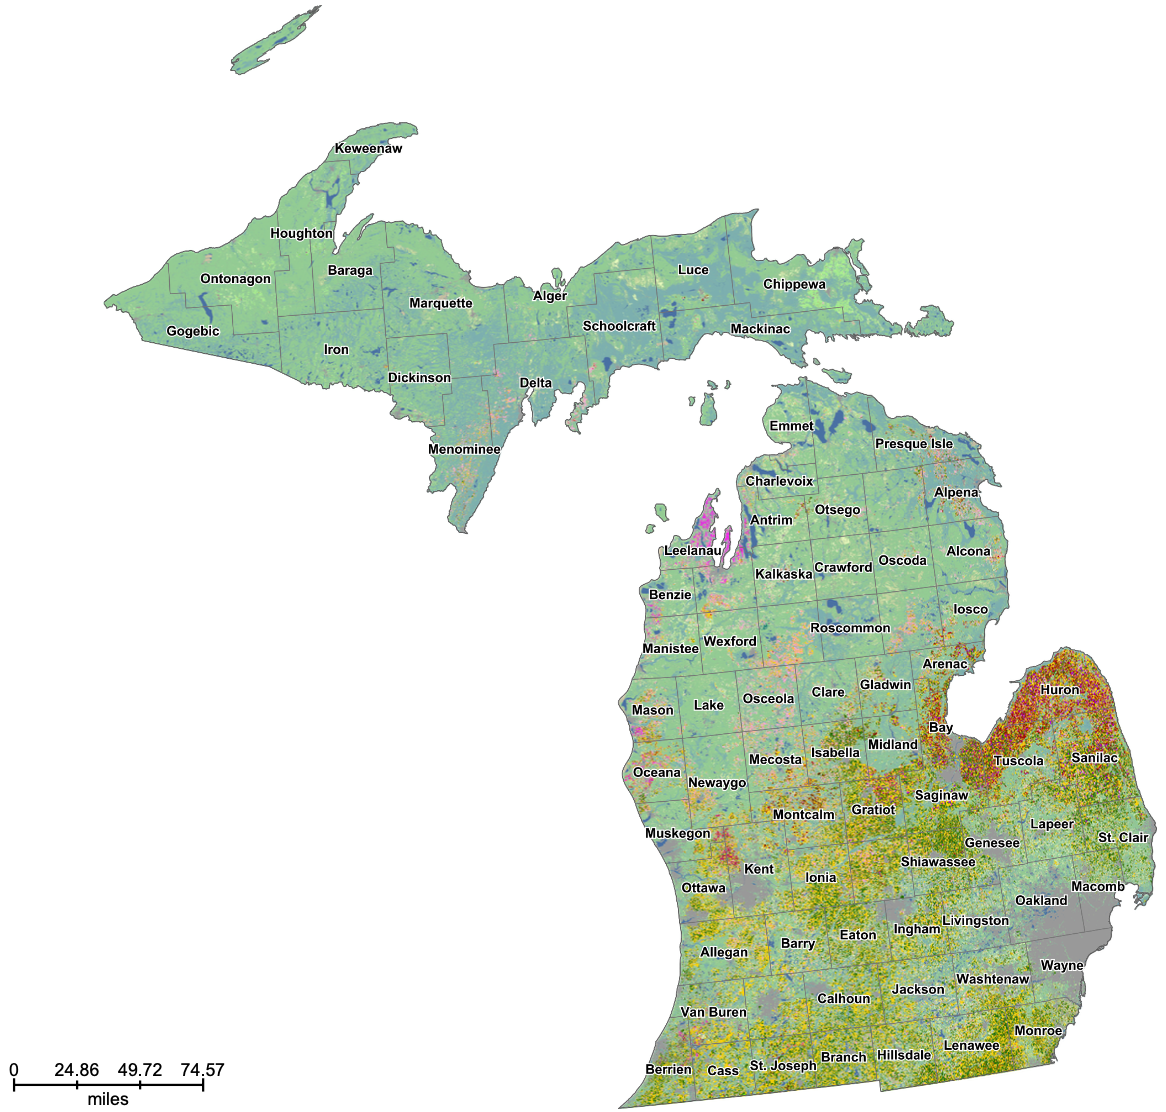
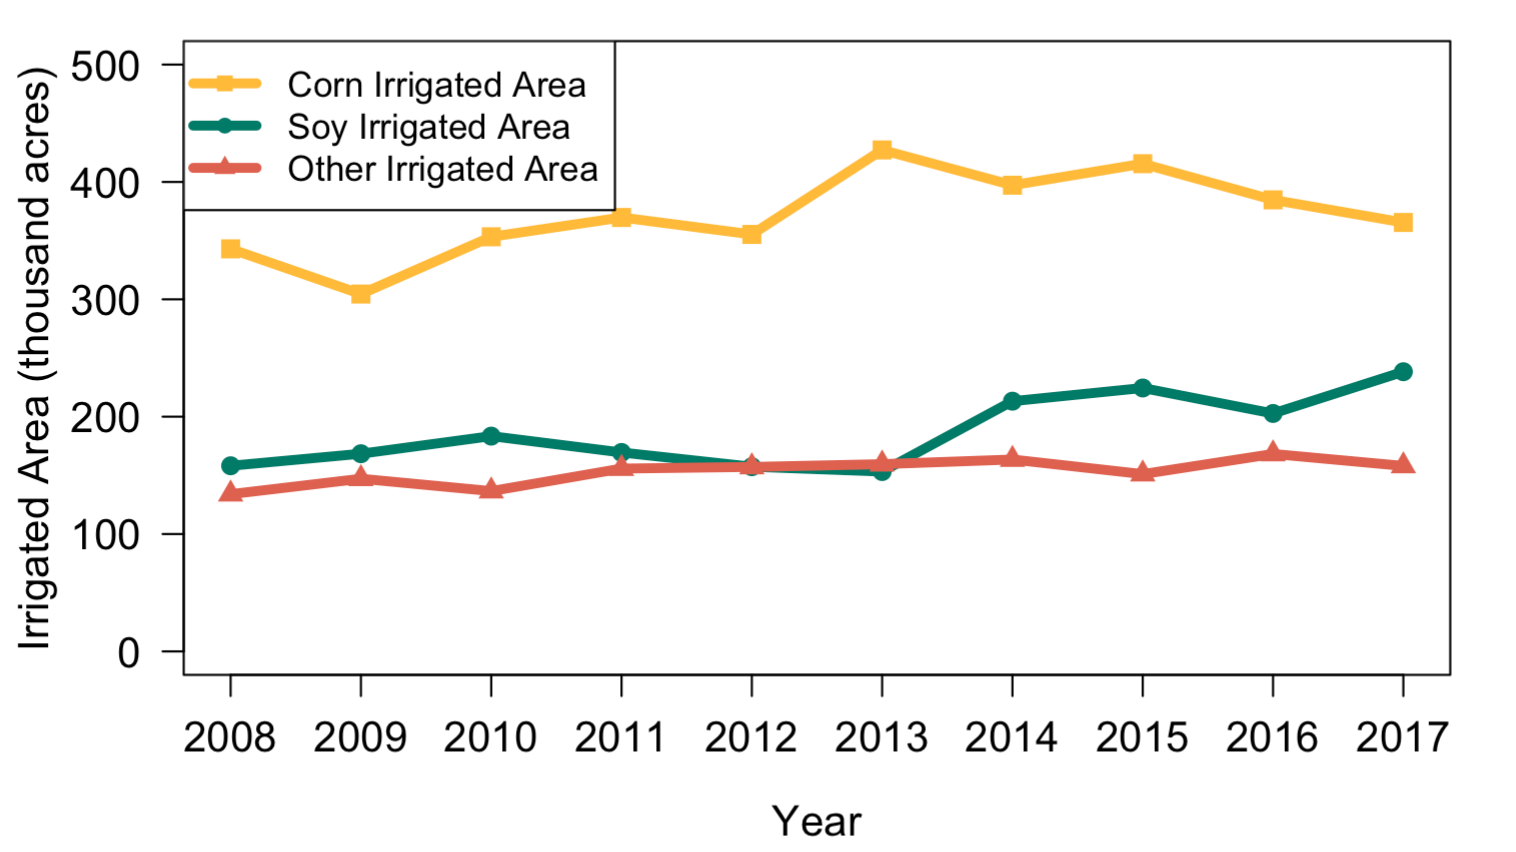
Figure 5 illustrates the trends in irrigated area for corn, soy and other crops from 2008 to 2017. Note that this timeframe is different from the timeframe in Figure 1, which spans 1997 to 2017. Irrigated corn acres increased 7% between 2008 and 2017. However, irrigated soy acres saw a notable increase of 51% during the same timeframe, with the vast majority of this growth occurring since 2013. Irrigated area for other crops shows an increase of 18% over the period between 2008 and 2017.
Conclusions
In this article, we have presented evidence of the increasing trend in irrigation across Michigan over the past two decades, considering both irrigated areas and the quantity of water used for irrigation, based on various data sources. We find that Michigan’s total irrigated area has increased over the past 25 years, although the share of total cropland that is irrigated has decreased in counties that border Indiana and Ohio due to large increases in non-irrigated cropland. Despite this, irrigation water use remains high in southwestern Michigan. The future outlook for Michigan irrigation use will depend on both climatic and policy factors.
