


Using climatology to estimate first freezing temperatures of the fall season
 Print
Print Email
EmailStatistics help narrow down the timing of first freezing temperatures across Michigan.

In Michigan, the dates of first freezing temperature (32 degrees Fahrenheit or less) and/or killing freeze (28 F or less) in the fall season may be a major factor in determining harvest dates, final yields as well as grain, fruit or vegetable quality. First fall freeze events (and last freeze events of the spring season) are the result of a complex mix of large, synoptic-scale and local, micro-scale factors. Unfortunately, from a meteorological perspective there is no reliable way to forecast these events more than a few days in advance. As a result, statistical summaries of past observed first freezes are arguably the best strategy for planning when these events may occur.
Statistics for first dates of occurrence of 28 F and 32 F in the fall were calculated for 53 sites in and near Michigan from 1981-2018 and are given in Tables 1 and 2 at the bottom of this article. The tables provide summaries of first, last, 10th, 30th, 50th (median), 70th and 90th percentiles. The percentile dates denote the dates by which that percentage of first freezes have occurred during the period of record. For example, at Lansing the 30th percentile for the first 32 F event is Sept. 30. This indicates that on average only 30% of all first fall 32 F events have occurred on or before Sept. 30. Conversely, it also indicates that 70% (100% - 30%) of all first 32 F events have occurred after Sept. 30.
The dates can also be used in combination to determine what fraction of all years that have occurred between percentiles of interest. For example, the 10th percentile through the 90th percentile statistically comprises 80% (or four out of every five events) of all possible events in the period of record. Surprisingly, at most locations, this range of dates is only about three or four weeks. At Lansing, the table indicates the 50th percentile (median) first freeze date to be Oct. 6, and in one out of 10 years it is as early as Sept. 22 (the 10th percentile) and as late as Oct. 21 (the 90th percentile). It is important to note that these statistics refer to temperature observations taken at a 5-foot level inside an instrument enclosure. Actual temperatures near the ground surface may be several degrees colder, especially under clear, calm, stratified conditions, even though the 5-foot instrument shelter/enclosure temperature is still above freezing.
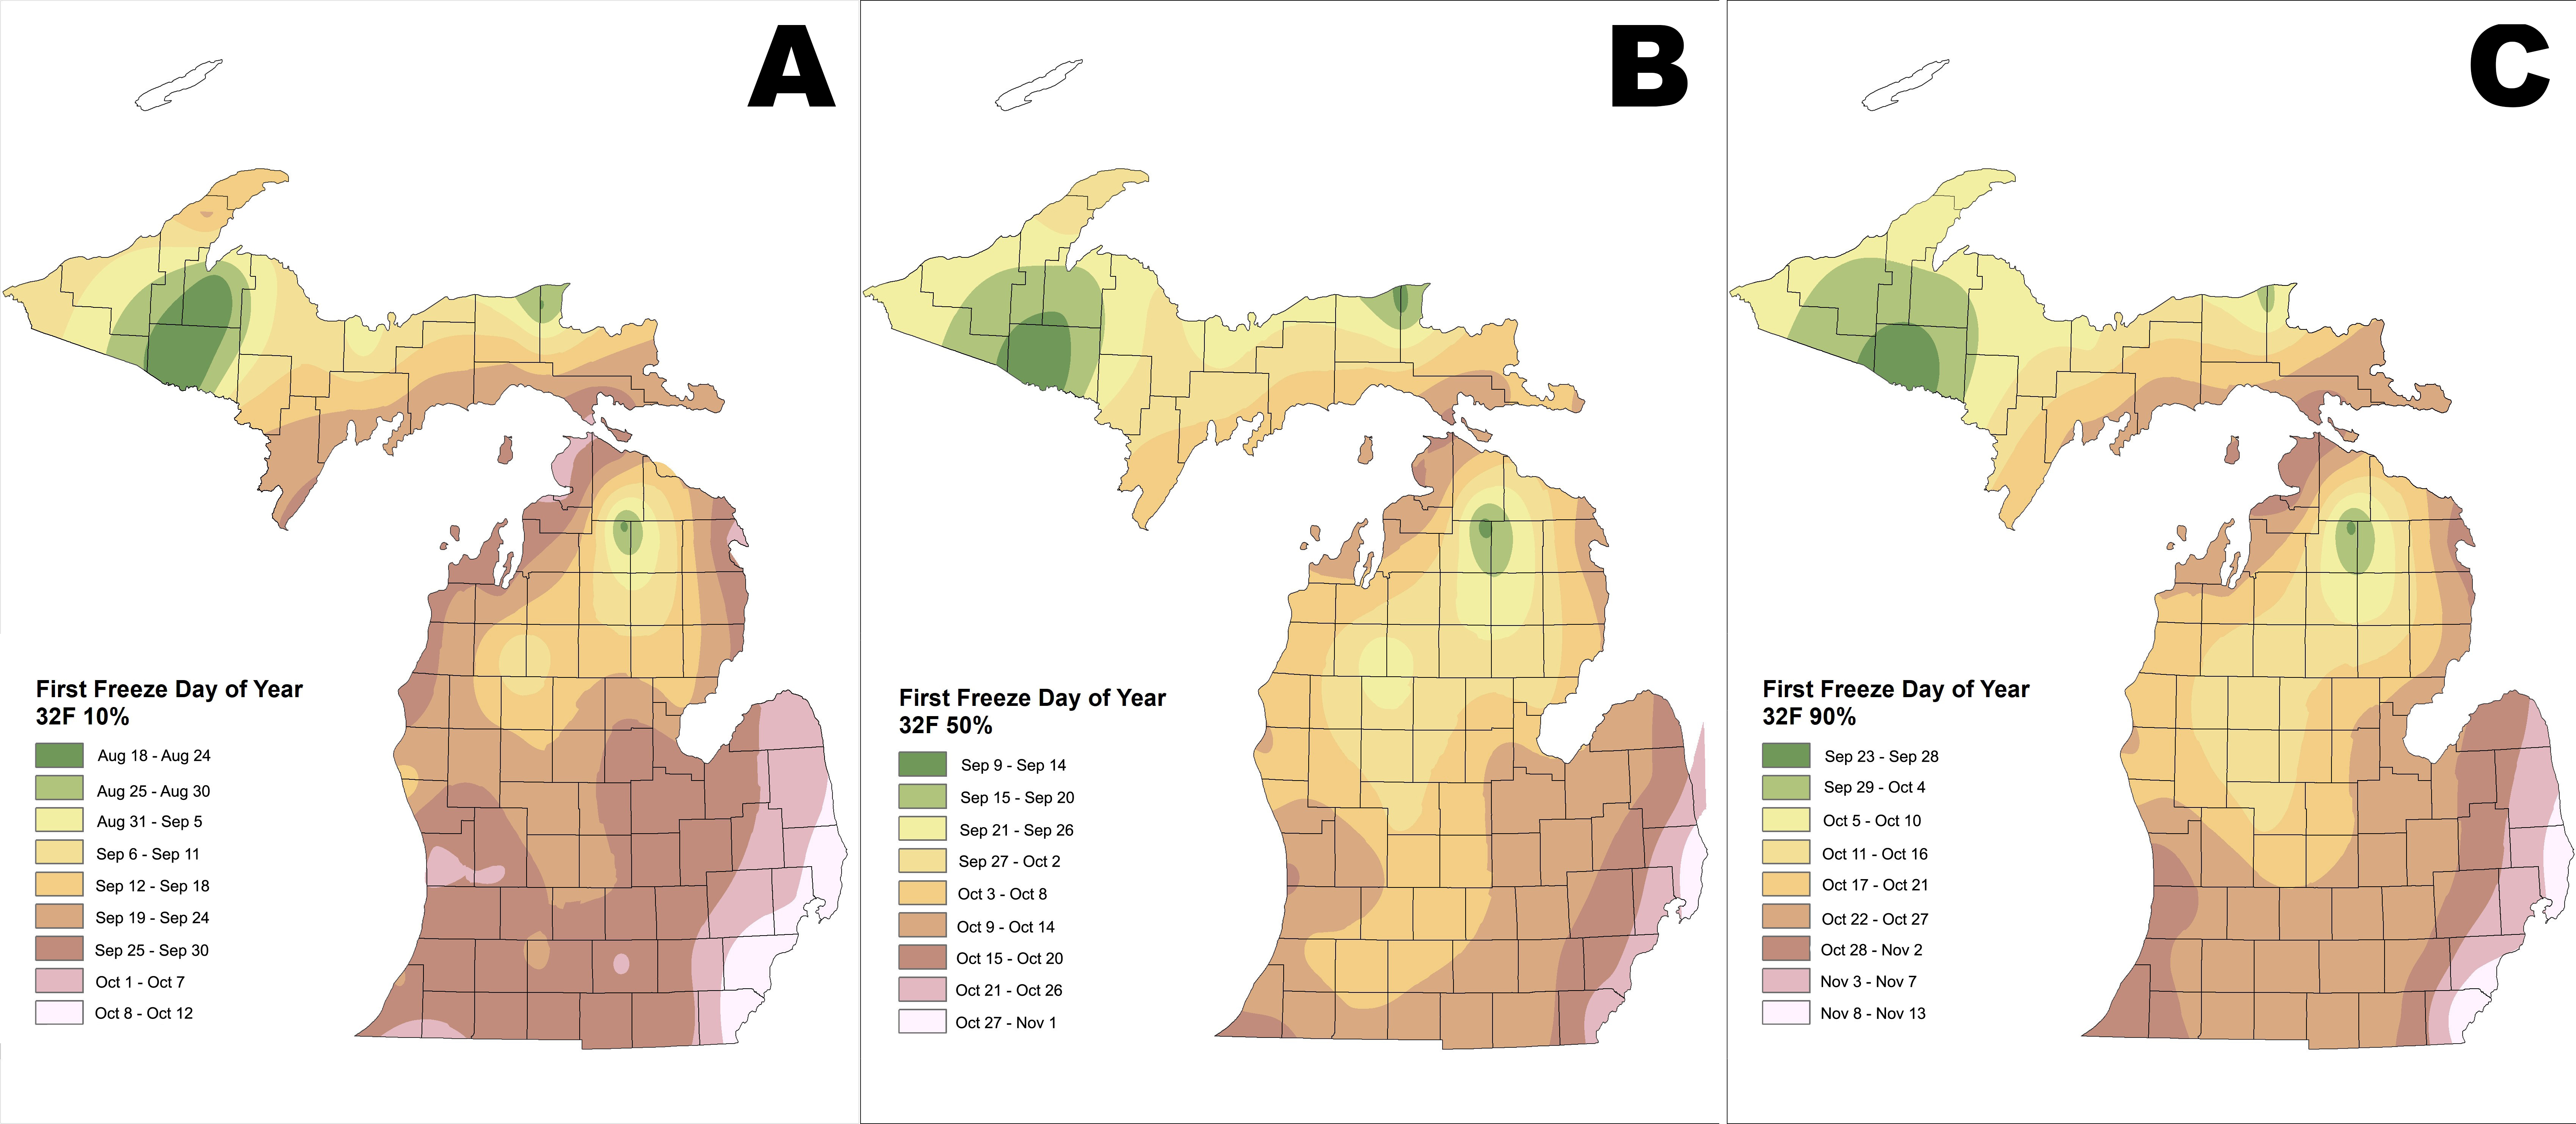
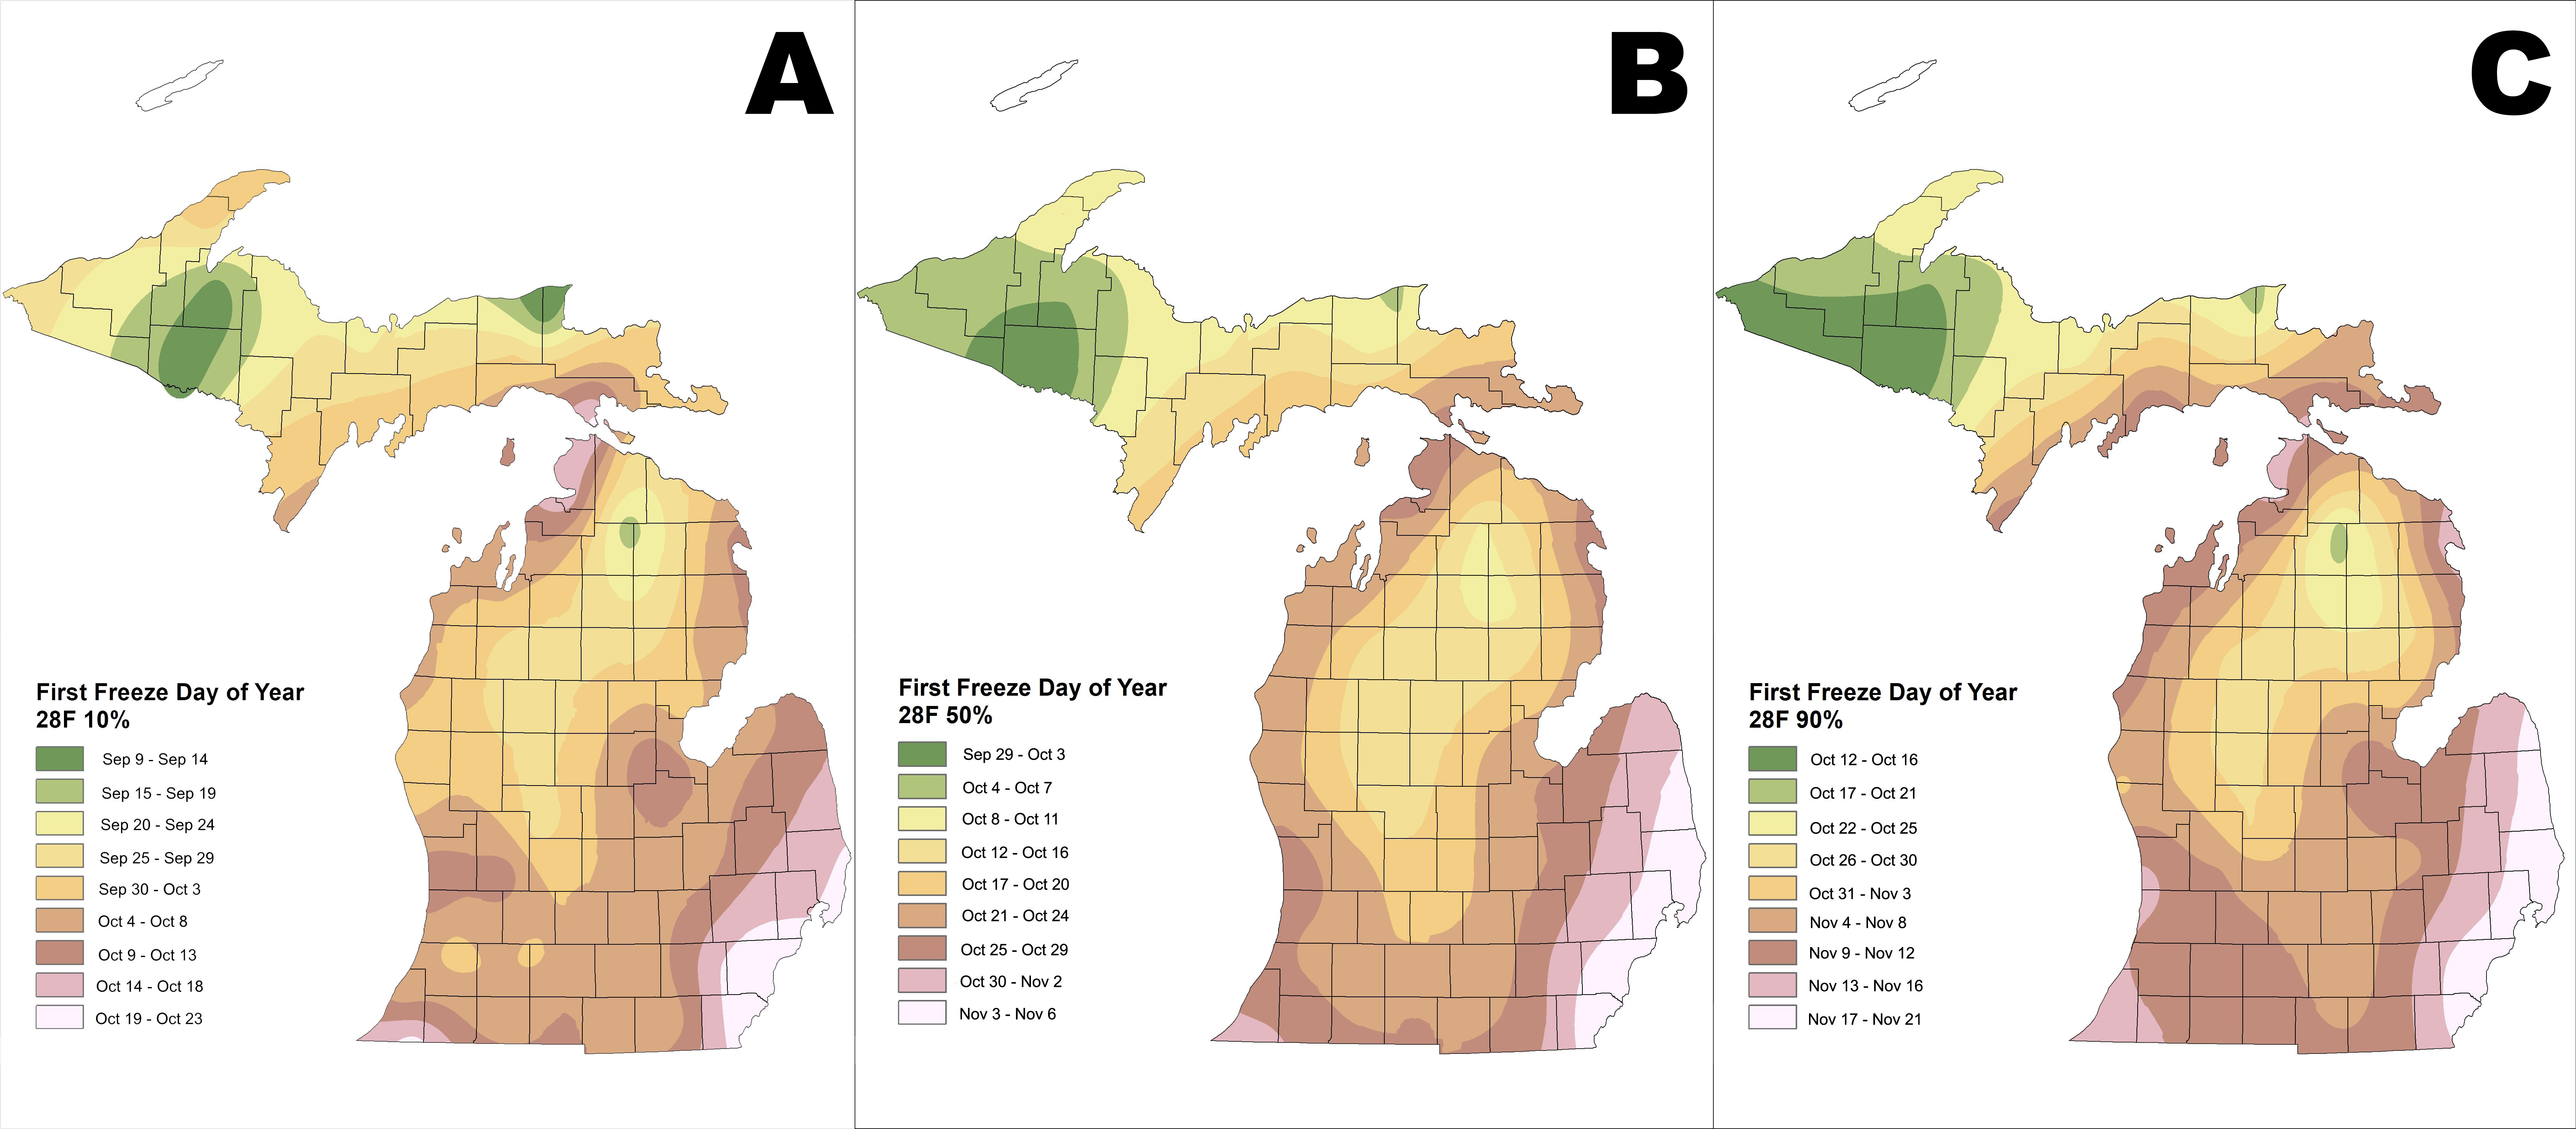
Map images of the 10th, 50th and 90th percentile dates of first 32 F and 28 F in the fall are given in Figures 1 and 2. Geographically, the average dates of first fall freeze in Michigan depend greatly on proximity to the lakes. Several weeks separate the earliest occurring events in interior sections of the Upper and northern Lower Peninsulas compared to the latest events at stations along the lakeshores in southeast and southwest corners of Lower Michigan. The overall latest normal dates of fall freezes are in the southeast corner of the state along Lakes Erie, St. Claire and Huron.
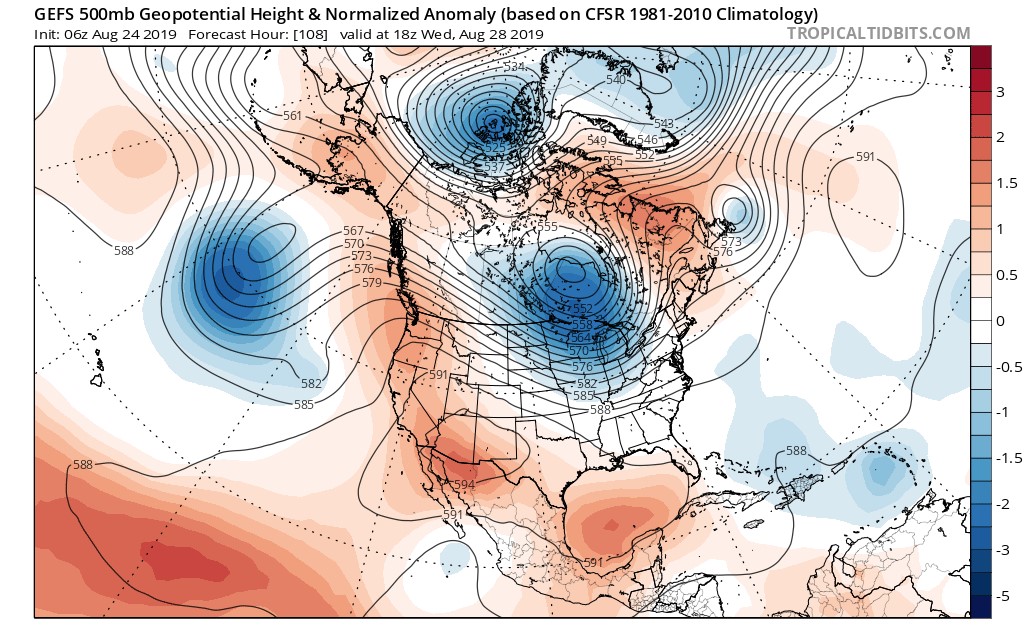
As noted earlier, there is no accurate way to predict when fall freeze events will occur more than a few days in advance. However, certain weather patterns and conditions are strongly correlated. The overwhelming majority of freeze events during this time of the year are accompanied by relatively calm, cloudless weather conditions during evening and early morning hours. These so-called “radiation freeze” conditions are usually associated with a large Canadian-origin area of high pressure and relatively low humidity. To track the movement of these air masses into the Midwest, follow the National Weather Service 6-10 and 8-14 day outlooks and extended outlooks. Watch for a northwesterly or northerly configuration of the jet stream across the central and eastern U.S. as this is the predominant meteorological pattern capable of bringing unseasonably cold air into the region at that time of the year (Figure 3).
There are several other major landscape-related factors that strongly influence the risk of freezing temperatures. The first is topography. During relatively clear, calm conditions, the ground surface cools and some of the air near the surface cools to a temperature below that of layers above. Since cool air is denser than warm air, the air cooled near the surface begins to flow downhill like a liquid due to the force of gravity. This movement of air is referred to as “cold air drainage” and is one of the primary reasons fruit crops can be successfully grown in Michigan (mainly on hilltops where cooler air drains away). Because of this, hilltops, ridges, hillsides and other topographical features from which relatively cooler air can drain away are relatively less likely to experience frost formation. In contrast, low-lying areas, especially depressions where cold air can literally collect or pond, are significantly more likely to experience a greater frequency and length of frost. The rule of thumb here is that concave topographical features (relative to the sky) are climatologically cooler than convex features.
Another important factor is soil moisture. All else being equal, a soil with greater water content will have greater thermal conductivity than the same soil at lesser water content and will allow more heat flux out of the ground towards the surface and keep it warmer than would otherwise be the case. On a longer-term basis, this also means that coarse-textured soils with lesser water holding capacities will generally experience more freezing temperatures than sites with fine-textured soils of greater water-holding capacities.
One special type of environment in Michigan to consider are production sites on muck soils. Such sites are typically among the coldest during radiation freeze events for a couple of reasons:
- They are almost always relatively flat and low in elevation and allow for the accumulation of cold air drained off of the surrounding landscape.
- Such soils with high organic matter content behave somewhat differently than mineral soils with an overall reduction in upward soil heat flux, especially if the soil is dry.
The combination of these factors leads to a relatively high risk of frost/freeze at muck sites, with minimum temperatures frequently several degrees colder than the surrounding landscape.
The presence of vegetation and/or the crop residue on a surface can also have a significant influence on frost formation. Overhanging vegetation can directly interfere with radiative heat loss of the surface, reducing the rate of radiative cooling and preventing frost formation on the surface. In contrast, dense vegetation or layers of crop residue near the surface can trap large quantities of air, which in turn can insulate the ground surface, slowing upward soil heat flux at night and leaving it relatively more susceptible to freezing temperatures.
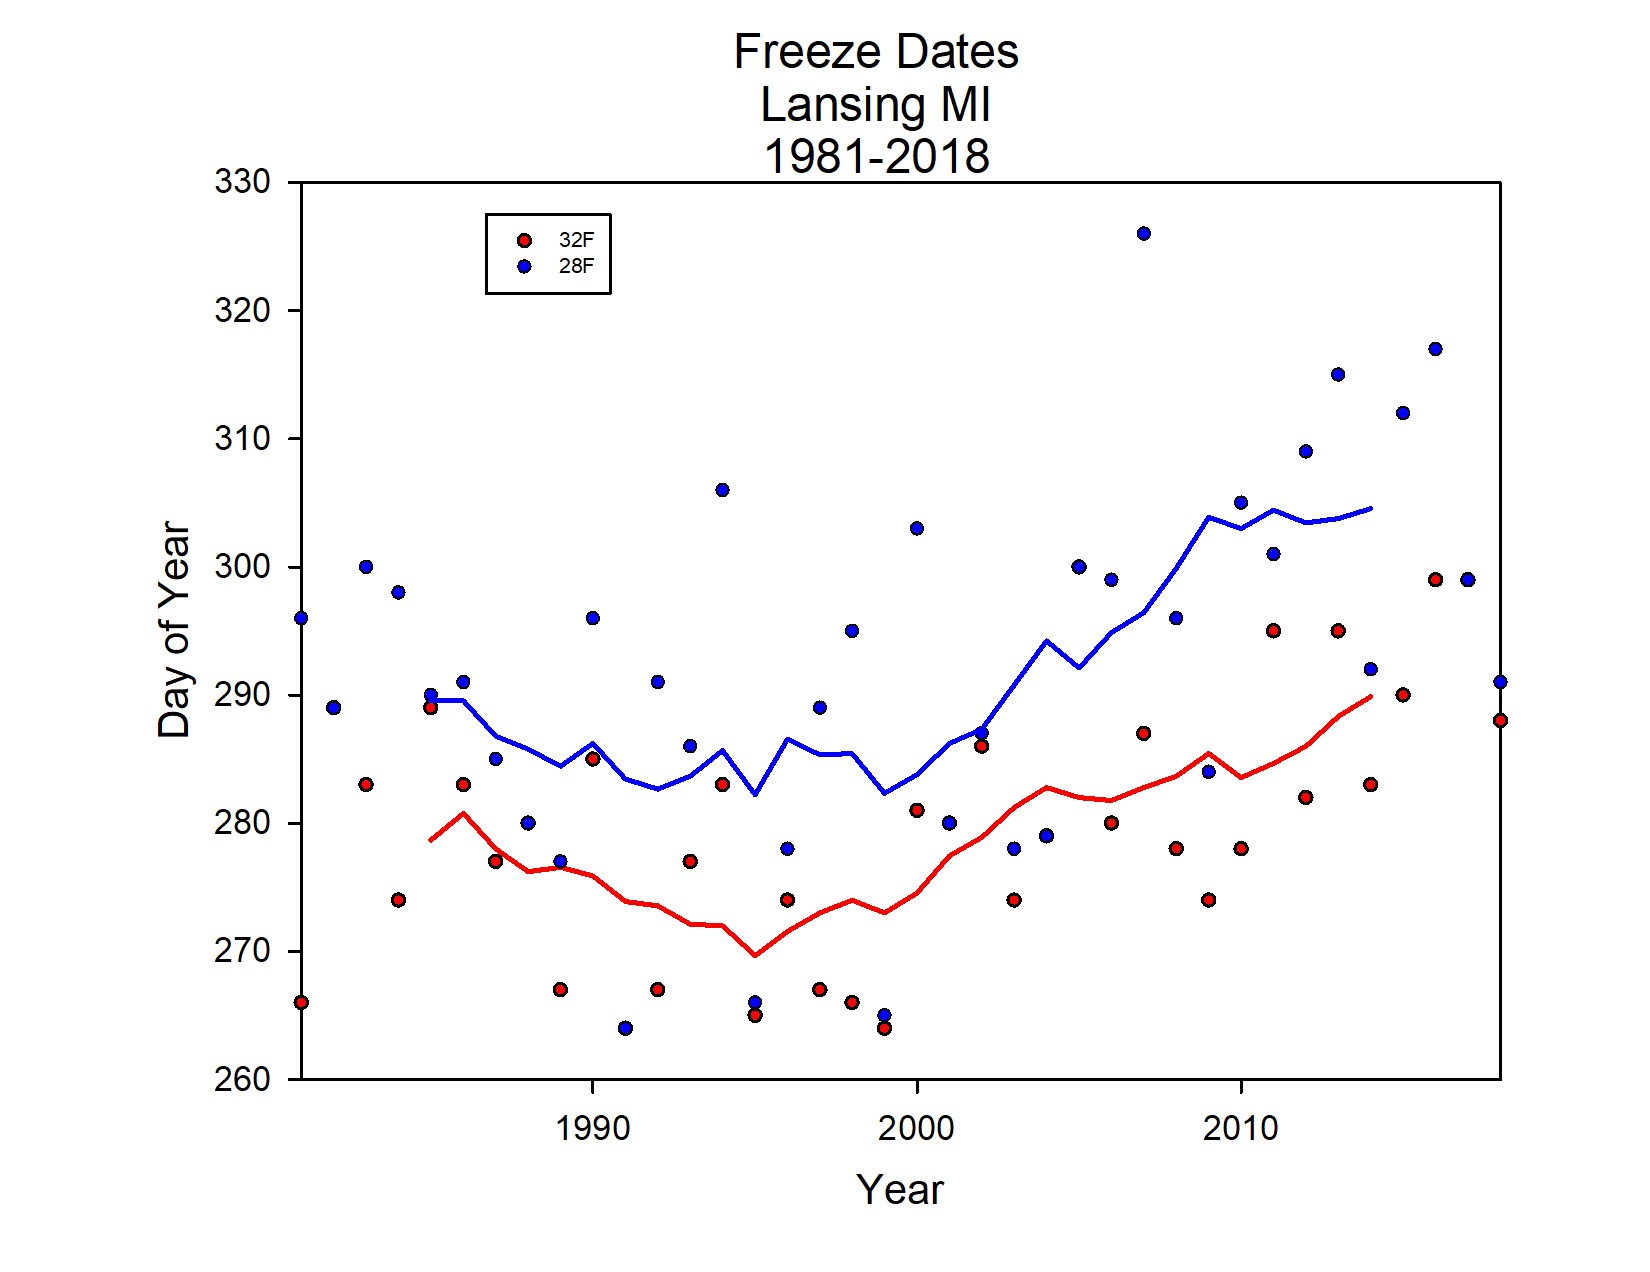
While the statistical summaries provided here are a good reference for the timing of first fall freezes, there is one additional factor to consider. Mean temperatures across Michigan and the Great Lakes region have warmed more than 2 F since the early 1980s, and one result of this warming is a gradually later date of first freeze in the fall season with time during the last 30 years (i.e., we are shooting at a moving target). This is illustrated in Figure 4 for Lansing. As can be observed in the figure, the dates of both first 32 F and 28 F have tended to occur about 10 days later over time during the 38-year period of record. As a result, the dates in the statistics tables might be considered somewhat early (a few days) when considering first freeze timing this fall or in the near future.
|
Table 1. Dates of first freezing temperatures (32 F or less) in the fall season at selected sites in and near Michigan, 1981-2018. The dates at each site are presented for selected percentiles based on empirical observations: first and last observations, and 10th, 30th, 50th (median or normal), 70th and 90th percentiles. For example, the 70th percentile date at Iron Mountain is 10/1, which indicates that for 70% of the 38 years of observations, the first 32 F has occurred on or before 10/1. Another way of interpreting this number is that the empirical chances of first fall 32 F occurring after 10/1 is 30% (100% minus 70%). | |||||||
|---|---|---|---|---|---|---|---|
|
Station |
First |
10 |
30 |
50 |
70 |
90 |
Last |
|
Iron Mountain |
9/6 |
9/14 |
9/21 |
9/27 |
10/1 |
10/6 |
10/13 |
|
Marquette |
9/5 |
9/8 |
9/18 |
9/26 |
10/1 |
10/6 |
10/13 |
|
Manistique |
9/7 |
9/22 |
10/1 |
10/5 |
10/11 |
10/26 |
11/3 |
|
Newberry |
9/2 |
9/14 |
9/22 |
9/28 |
10/4 |
10/14 |
10/19 |
|
S.S. Marie |
8/28 |
9/14 |
9/25 |
10/4 |
10/10 |
10/20 |
10/25 |
|
Cadillac |
8/20 |
9/4 |
9/15 |
9/21 |
9/30 |
10/7 |
10/17 |
|
Manistee |
8/29 |
9/25 |
10/1 |
10/5 |
10/10 |
10/18 |
11/2 |
|
Petoskey |
9/24 |
9/29 |
10/6 |
10/13 |
10/21 |
10/31 |
11/7 |
|
Alpena |
9/6 |
9/14 |
9/21 |
9/27 |
10/1 |
10/6 |
10/13 |
|
Gaylord |
9/6 |
9/14 |
9/21 |
9/27 |
10/1 |
10/6 |
10/13 |
|
Hale |
9/6 |
9/14 |
9/21 |
9/27 |
10/1 |
10/6 |
10/13 |
|
Muskegon |
9/22 |
9/28 |
10/4 |
10/10 |
10/16 |
10/24 |
11/10 |
|
Montague |
9/3 |
9/11 |
9/23 |
10/2 |
10/7 |
10/13 |
10/25 |
|
Hart |
9/21 |
9/24 |
10/1 |
10/8 |
10/11 |
10/23 |
11/12 |
|
Big Rapids |
8/28 |
9/18 |
9/23 |
9/29 |
10/2 |
10/10 |
10/17 |
|
Gladwin |
8/27 |
9/21 |
9/27 |
10/2 |
10/6 |
10/19 |
10/25 |
|
Midland |
9/22 |
9/28 |
10/4 |
10/10 |
10/15 |
10/22 |
11/7 |
|
Bad Axe |
9/6 |
9/14 |
9/21 |
9/27 |
10/1 |
10/6 |
10/13 |
|
Standish |
8/28 |
9/15 |
9/23 |
9/30 |
10/6 |
10/23 |
11/30 |
|
Benton Harbor |
9/12 |
9/22 |
10/3 |
10/10 |
10/16 |
10/26 |
11/2 |
|
Battle Creek |
9/10 |
9/22 |
9/30 |
10/3 |
10/12 |
10/24 |
11/30 |
|
Lansing |
9/20 |
9/22 |
9/30 |
10/6 |
10/10 |
10/21 |
10/26 |
|
Coldwater |
9/20 |
9/23 |
10/4 |
10/9 |
10/15 |
10/22 |
10/27 |
|
Ann Arbor |
9/23 |
10/1 |
10/8 |
10/14 |
10/20 |
10/26 |
11/7 |
|
Detroit |
10/2 |
10/10 |
10/15 |
10/18 |
10/25 |
11/6 |
11/12 |
|
Flint |
9/16 |
9/23 |
10/1 |
10/9 |
10/14 |
10/21 |
10/29 |
|
Ironwood |
8/27 |
9/9 |
9/22 |
9/25 |
9/29 |
10/6 |
10/26 |
|
Maple City |
9/15 |
9/23 |
9/30 |
10/7 |
10/11 |
10/21 |
11/12 |
|
Cheboygan |
9/11 |
9/25 |
10/3 |
10/7 |
10/12 |
10/25 |
11/3 |
|
Vanderbilt |
8/10 |
8/20 |
9/3 |
9/10 |
9/14 |
9/19 |
10/9 |
|
Sandusky |
9/23 |
10/1 |
10/9 |
10/14 |
10/19 |
11/2 |
11/8 |
|
Monroe |
10/1 |
10/9 |
10/13 |
10/22 |
10/31 |
11/15 |
11/18 |
|
Jackson |
9/20 |
9/30 |
10/4 |
10/8 |
10/14 |
10/22 |
11/2 |
|
Three Rivers |
9/20 |
9/27 |
10/4 |
10/7 |
10/13 |
10/22 |
10/28 |
|
Grand Rapids |
9/22 |
9/29 |
10/6 |
10/11 |
10/17 |
10/24 |
11/12 |
|
Mt Clemens |
9/27 |
10/5 |
10/12 |
10/22 |
10/27 |
11/3 |
11/16 |
|
Holland |
9/23 |
9/29 |
10/5 |
10/14 |
10/22 |
10/31 |
11/13 |
|
South Bend, IN |
9/27 |
10/3 |
10/11 |
10/16 |
10/23 |
11/1 |
11/10 |
|
Toledo, OH |
9/20 |
9/30 |
10/5 |
10/14 |
10/18 |
10/27 |
11/2 |
|
Herman |
8/10 |
8/16 |
9/11 |
9/15 |
9/27 |
10/1 |
10/9 |
|
Stambaugh |
8/13 |
8/16 |
8/31 |
9/7 |
9/11 |
9/19 |
10/3 |
|
Escanaba |
9/15 |
9/21 |
9/26 |
10/2 |
10/11 |
10/22 |
11/2 |
|
Chatham |
8/17 |
9/1 |
9/11 |
9/22 |
9/29 |
10/6 |
10/14 |
|
Tahquamenon Falls |
8/4 |
8/22 |
9/5 |
9/12 |
9/18 |
9/29 |
10/31 |
|
St. Ignace |
9/26 |
9/30 |
10/11 |
10/15 |
10/24 |
11/2 |
11/10 |
|
Traverse City |
8/28 |
9/24 |
10/2 |
10/6 |
10/13 |
10/22 |
10/26 |
|
Mio |
8/27 |
9/7 |
9/18 |
9/23 |
9/30 |
10/8 |
11/30 |
|
Bloomingdale |
9/20 |
9/25 |
10/2 |
10/6 |
10/11 |
10/25 |
11/8 |
|
Greenville |
9/3 |
9/18 |
9/23 |
9/30 |
10/2 |
10/11 |
10/31 |
|
Adrian |
8/28 |
9/23 |
10/2 |
10/9 |
10/14 |
10/25 |
12/7 |
|
Port Huron |
9/23 |
10/10 |
10/17 |
10/31 |
11/6 |
11/12 |
11/21 |
|
Marinette WI |
9/21 |
9/23 |
10/2 |
10/7 |
10/13 |
10/21 |
10/28 |
|
Houghton |
9/9 |
9/18 |
9/25 |
9/29 |
10/4 |
10/10 |
10/30 |
|
Table 2. Dates of first killing freezing temperatures (28 F or less) in the fall season at selected sites in and near Michigan, 1981-2018. The dates at each site are presented for selected percentiles based on empirical observations: first and last observations, and 10th, 30th, 50th (median or normal), 70th and 90th percentiles. For example, the 70th percentile date at Iron Mountain is 10/11, which indicates that for 70% of the 38 years of observations, the first 28 F has occurred on or before 10/11. Another way of interpreting this number is that the empirical chances of first fall 28 F occurring after 10/11 is 30% (100% minus 70%). | |||||||
|---|---|---|---|---|---|---|---|
|
Station |
First |
10 |
30 |
50 |
70 |
90 |
Last |
|
Iron Mountain |
9/22 |
9/25 |
10/2 |
10/7 |
10/11 |
10/20 |
10/28 |
|
Marquette |
9/18 |
9/22 |
10/2 |
10/8 |
10/12 |
10/20 |
10/30 |
|
Manistique |
9/14 |
9/30 |
10/12 |
10/23 |
10/31 |
11/14 |
11/25 |
|
Newberry |
9/18 |
9/27 |
10/3 |
10/7 |
10/20 |
10/25 |
11/11 |
|
S.S. Marie |
9/16 |
9/27 |
10/11 |
10/16 |
10/22 |
11/3 |
11/19 |
|
Cadillac |
8/28 |
9/22 |
9/30 |
10/6 |
10/9 |
10/24 |
10/29 |
|
Manistee |
9/23 |
10/3 |
10/17 |
10/26 |
10/31 |
11/9 |
11/23 |
|
Petoskey |
9/26 |
10/15 |
10/29 |
11/4 |
11/8 |
11/17 |
11/26 |
|
Alpena |
9/22 |
9/25 |
10/2 |
10/7 |
10/11 |
10/20 |
10/28 |
|
Gaylord |
9/22 |
9/25 |
10/2 |
10/7 |
10/11 |
10/20 |
10/28 |
|
Hale |
9/22 |
9/25 |
10/2 |
10/7 |
10/11 |
10/20 |
10/28 |
|
Muskegon |
9/26 |
10/4 |
10/16 |
10/26 |
10/31 |
11/7 |
11/12 |
|
Montague |
9/5 |
9/29 |
10/4 |
10/10 |
10/16 |
10/26 |
11/12 |
|
Hart |
9/26 |
10/6 |
10/21 |
10/27 |
10/31 |
11/8 |
11/12 |
|
Big Rapids |
9/22 |
9/27 |
10/3 |
10/9 |
10/16 |
10/26 |
11/1 |
|
Gladwin |
9/26 |
10/1 |
10/10 |
10/14 |
10/21 |
11/2 |
12/6 |
|
Midland |
9/26 |
10/12 |
10/17 |
10/29 |
11/3 |
11/12 |
11/20 |
|
Bad Axe |
9/22 |
9/25 |
10/2 |
10/7 |
10/11 |
10/20 |
10/28 |
|
Standish |
9/23 |
9/30 |
10/7 |
10/17 |
10/26 |
10/31 |
11/30 |
|
Benton Harbor |
9/23 |
10/3 |
10/16 |
10/25 |
11/1 |
11/12 |
11/19 |
|
Battle Creek |
9/23 |
10/1 |
10/10 |
10/17 |
10/25 |
11/10 |
11/30 |
|
Lansing |
9/20 |
10/3 |
10/12 |
10/17 |
10/25 |
11/4 |
11/21 |
|
Coldwater |
10/1 |
10/7 |
10/17 |
10/25 |
10/31 |
11/10 |
12/1 |
|
Ann Arbor |
10/8 |
10/15 |
10/25 |
11/1 |
11/4 |
11/13 |
11/19 |
|
Detroit |
10/8 |
10/21 |
11/1 |
11/3 |
11/9 |
11/20 |
11/22 |
|
Flint |
9/22 |
10/4 |
10/12 |
10/20 |
10/25 |
11/3 |
11/19 |
|
Ironwood |
9/20 |
9/24 |
10/2 |
10/5 |
10/9 |
10/14 |
10/26 |
|
Maple City |
9/26 |
10/3 |
10/13 |
10/21 |
10/28 |
11/9 |
11/12 |
|
Cheboygan |
9/11 |
9/28 |
10/13 |
10/23 |
10/31 |
11/7 |
11/20 |
|
Vanderbilt |
8/27 |
9/15 |
9/23 |
9/30 |
10/5 |
10/11 |
10/17 |
|
Sandusky |
10/9 |
10/12 |
10/19 |
11/2 |
11/8 |
11/15 |
11/23 |
|
Monroe |
10/16 |
10/20 |
11/1 |
11/8 |
11/12 |
11/17 |
11/22 |
|
Jackson |
9/27 |
10/4 |
10/14 |
10/18 |
10/25 |
11/1 |
11/19 |
|
Three Rivers |
9/23 |
10/4 |
10/14 |
10/23 |
10/31 |
11/7 |
11/12 |
|
Grand Rapids |
9/27 |
10/10 |
10/20 |
10/26 |
11/2 |
11/9 |
11/18 |
|
Mt Clemens |
10/7 |
10/16 |
10/28 |
11/1 |
11/7 |
11/15 |
11/22 |
|
Holland |
9/26 |
10/11 |
10/26 |
11/2 |
11/10 |
11/16 |
12/10 |
|
South Bend, IN |
10/8 |
10/21 |
10/27 |
11/1 |
11/4 |
11/14 |
11/21 |
|
Toledo, OH |
10/2 |
10/13 |
10/21 |
10/28 |
11/1 |
11/8 |
11/19 |
|
Herman |
9/5 |
9/10 |
9/23 |
9/29 |
10/3 |
10/11 |
10/24 |
|
Stambaugh |
9/6 |
9/10 |
9/15 |
9/21 |
9/27 |
10/8 |
10/12 |
|
Escanaba |
9/21 |
10/1 |
10/7 |
10/15 |
10/22 |
11/4 |
11/6 |
|
Chatham |
9/5 |
9/22 |
9/30 |
10/7 |
10/10 |
10/17 |
11/1 |
|
Tahquamenon Falls |
8/4 |
9/8 |
9/16 |
9/29 |
10/5 |
10/14 |
11/1 |
|
St. Ignace |
9/27 |
10/18 |
10/31 |
11/2 |
11/8 |
11/16 |
12/3 |
|
Traverse City |
9/26 |
10/3 |
10/17 |
10/25 |
10/30 |
11/6 |
11/12 |
|
Mio |
8/27 |
9/25 |
10/3 |
10/6 |
10/11 |
10/23 |
11/30 |
|
Bloomingdale |
9/21 |
9/30 |
10/8 |
10/17 |
10/25 |
11/4 |
11/19 |
|
Greenville |
9/22 |
9/25 |
10/2 |
10/7 |
10/13 |
10/25 |
11/8 |
|
Adrian |
9/22 |
10/4 |
10/16 |
10/22 |
10/28 |
11/7 |
12/7 |
|
Port Huron |
10/8 |
10/17 |
11/1 |
11/5 |
11/13 |
11/21 |
12/19 |
|
Marinette, WI |
9/23 |
10/4 |
10/12 |
10/21 |
10/31 |
11/13 |
11/20 |
|
Houghton |
9/27 |
10/1 |
10/10 |
10/16 |
10/19 |
10/30 |
11/11 |

